Consider this: A project manager is stuck between managing different projects, each with a different deadline and team. Imagine if he could get a comprehensive look at all of them simultaneously. This is exactly what a Gantt chart will help him do—managing products into a structured chart containing all project details.
This article explores what a Gantt chart is, how it’s used and its pros and cons. We will also look at the steps to create one with a Gantt chart example.
What is a Gantt chart?
A Gantt chart is a visual progress management tool useful for project managers. Instead of the need to ask different employees about the project status and deadlines, it provides everyday necessary details in one place. The use of this tool started in the 1900s and is named after its creator, Henry Gantt.
In this chart, you can display tasks as horizontal bars along a timeline. This shows their start and end dates. You can also get information on the dependencies, assignees, and progress. Professionals in the software development, construction, and marketing industries frequently use the tool to manage their projects.
What are Gantt charts used for?
You can use Gantt charts as a one-stop solution to accomplish various tasks. These include:
- Build and manage a comprehensive project: Gantt charts help managers break complex projects into smaller tasks. Each task can be displayed on a timeline with its dependencies, timelines, and assignees. It allows managers to have complete clarity on the project’s progress and stay organized.
- Determine task dependencies: All project managers know that a delay in one task can often cause delays in other related tasks. You cannot start certain tasks till the first one is complete. A Gantt chart provides a visual of interdependencies to ensure clarity and alignment.
- Monitor project progress: You can know how far each task in the project has come by looking at the horizontal bars. This helps you be aware of any project delays so you can adjust the deadlines accordingly.
Gantt charts make it easy to accomplish all these tasks in one go and are simple to manage complex projects.
Pros and cons of using Gantt charts
While Gantt charts help managers better track and manage the projects, the tool has pros and cons. Let us look at both its benefits and shortcomings to get a comprehensive understanding of the tools’ potential:
Pros of Gantt charts
Gantt charts come with a range of benefits for project managers. Here’s how it can help you:
- Project visualization: With Gantt charts, you get a bird’s-eye view of the project. This means that you can look at the bigger picture. Not just this, you can also view the project assignees, dependencies, and subtasks.
- Enhanced task management: You can break down complex tasks into smaller tasks. As a result, it becomes easier to prioritize work and assign responsibilities.
- Better collaboration: With Gantt charts, everyone knows what to do. This means it becomes easier to collaborate and also minimize overlaps.
- Better time management: With Gantt charts, managers know the task progress and dependencies. As a result, they can allocate resources wisely.
These benefits make Gantt charts helpful for project managers. They can ensure project alignment and utilize resources better.
Cons of Gantt charts
Gantt charts also have certain limitations that you must consider before using them for project management. These cons include:
- Complexity with large projects: Tracking extensive projects with several tasks within can be complex to track with Gantt charts. The chart can become extremely cluttered, making it difficult to follow.
- Limited flexibility: Any sudden changes in the project deadlines or assignees require a manual restructuring of the chart. Too many changes can become time-consuming and difficult to handle.
- Learning curve: Learning how to use and read Gantt charts can be tedious and time-consuming.
Consider these challenges of Gantt charts before using them for your project management needs.
How to create a Gantt chart?
Now that we know the pros and cons of using Gantt charts, let us look at the step-by-step process of creating them.
Let’s take an example alongside to understand better. Assume a manager wants to organize a product launch event. Here is a breakdown of how to craft a Gantt chart:
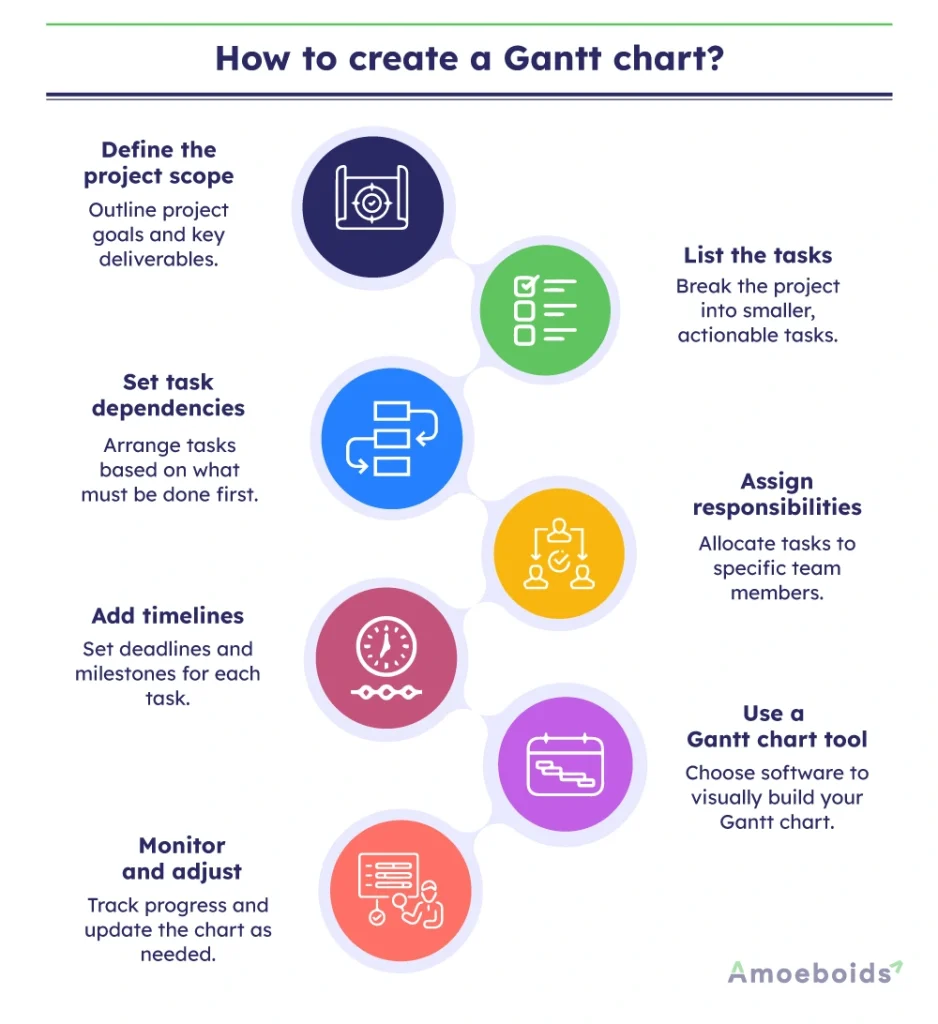
1. Define the project scope: The first step is to know what you want to accomplish. Outline the key objectives of the project and the deadlines. For this project, it would include securing a venue, promoting the event, coordinating speakers, and managing logistics.
2. List the tasks: Right after you have defined the project, break it down into smaller goals. These tasks can include booking a venue, sending invites, and planning social media marketing.
3. Set task dependencies: Once the tasks are listed, now is the time to arrange them chronologically. This helps identify which tasks are dependent on other tasks and create a plan. For example, you cannot send out invitations until the venue is confirmed.
4. Assign responsibilities: The next step is to assign the responsibilities to specific departments and employees so everyone is aware of what they must do. For example, the admin team books the venue, and the marketing team handles the promotions.
5. Add timelines: Define specific timelines and milestones for each task. For instance, the venue must be booked by Week 2, and invitations must be sent by Week 3.
6. Use a Gantt chart tool: The final step is to use a tool to draft the chart.
7. Monitor and adjust: Remember that creating a Gantt chart does not finish the process. You must monitor the progress of the project and make adjustments when required. For example, if there is a delay in finalizing the venue, the marketing team deadlines must be pushed forward.
Through these simple steps, you can craft Gantt charts for your team and ensure that all tasks are accomplished systematically, all while you have a visual of their progress.
Here’s a Gantt chart template that you can customize and use:
| Task ID | Project Scope | Tasks | Dependencies | Responsibilities | Timelines | Monitoring | Start Date | End Date | Duration (Days) | Status |
| 1 | Outline objectives and deadlines | Break project into smaller tasks | Arrange tasks chronologically | Allocate tasks to teams | Define specific deadlines for tasks | Track progress and update as needed | 01-Mar-25 | 03-Mar-25 | 3 | Pending |
| 2 | ||||||||||
| 3 |
Additionally, you can also check some Microsoft Gantt Chart templates that can be used in Microsoft Excel.
Best practices for creating effective Gantt charts
While Gantt charts are helpful, organizing them well is crucial. Here are some best practices to keep in mind while drafting a Gantt chart:
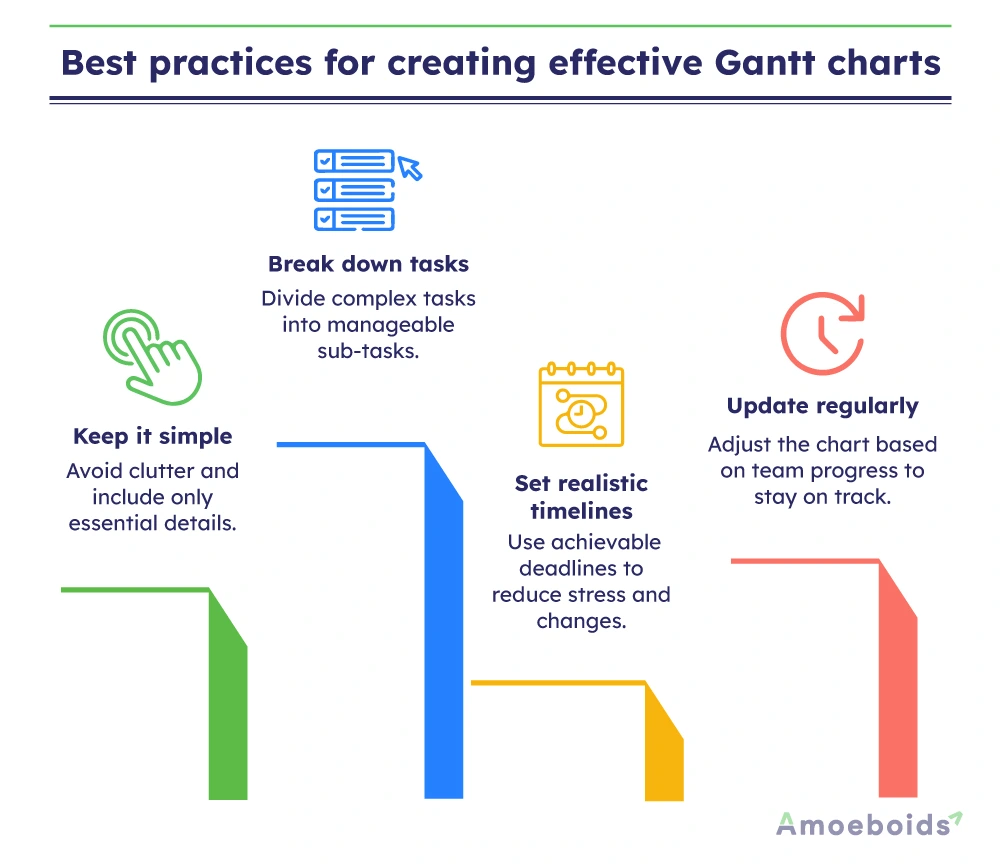
- Avoid cluttering your Gantt chart with an overload of unnecessary details, and keep the overall structure readable
- Break down complex tasks into smaller tasks that are easier to track
- Set realistic timelines that are easy to follow for the team to ensure there are minimal changes and no unnecessary stress
- Make adjustments to your Gantt charts regularly based on team progress to ensure that there is no chaos later
By following these best practices, you can make the most of the Gantt charts for project management.
Conclusion
Gantt charts are extremely useful in streamlining project management. They provide necessary information about a project at a glance, and managers can use them to ensure that teams are aligned without overlaps. Gantt charts also help in visualizing the project estimations taking into account interdependencies.
To create a Gantt chart, you only need to clearly define all the tasks and decide on project assignees. However, to make the most of it, it is crucial to continuously monitor the project’s progress and make changes accordingly. Project management tools like Jira, Trello, Asana, can help you plan, manage, and optimize your workflow effectively.
FAQs
1. How to color code Gantt charts?
Use different colors to categorize tasks by priority, team, or project phase for better visual clarity.
2. Are Gantt charts used in predictive projects?
Yes, Gantt charts are commonly used in predictive (waterfall) projects to plan tasks in a structured timeline.
3. How do you pronounce Gantt chart?
It is pronounced as “gant” (rhymes with “ant”) chart.
4. What does a Gantt chart show?
A Gantt chart shows the project’s progress at a glance. It also presents the task deadlines and the employees responsible for them.
5. How does a burndown chart differ from a Gantt chart?
A burndown chart tracks work completed over time. As against this, a Gantt chart visualizes task schedules.