
You’ve just started a project. A few weeks in, you’re getting overwhelmed with various organizational challenges, such as missed updates, scattered responsibilities and unclear timelines. Now, you are wondering why your team keeps missing deadlines. Everyone is giving their 100%, but you’re not sure why the progress is not as expected.
This is where a milestone chart in project management can make all the difference. By using this chart, you get a bird’s eye view of your entire project, from key moments to progress bottlenecks. This clarity helps you align your team better and tackle challenges in an efficient and time-bound manner.
So, let’s understand the ins and outs of how to create a milestone chart, learn about best practices while doing so, and look at some successful examples.
What is a milestone chart in project management?
A milestone diagram can be a simple XY graph that shows your project’s progress over a proposed timeline. You can also use it as a visual tool to represent tasks that your team needs to complete throughout the project. Once those specific tasks are completed, they are converted into milestones and shown as symbols or vertical bars on a horizontal timeline. Here is a typical milestone diagram for your reference:

You can color-code milestone charts, add labels or short descriptions and even include extra details like the responsible team or the percentage completed. The aim is to make progress easy to read and quick to understand for anyone.
Milestone charts are handy for planning, tracking and reporting your overall strategy and progress. Sometimes, project managers make the mistake of adding tasks to the timeline instead of milestones. It’s important to understand the distinct difference between the two.
Difference between milestones and tasks
Milestones are major achievements in your project. Tasks, on the other hand, are the specific activities or actions that help you reach those milestones.
Let’s look at a quick milestone chart example. You are launching a new app. For QA, you can add “Beta testing completed” as a milestone to the chart. However, to reach there, you have to perform a lot of tasks, such as preparing a test setup, running tests, preparing bug reports, resolving them and collecting feedback.
This simple table illustrates how milestones differ from regular tasks.
| Milestones | Tasks |
| Represent key achievements or checkpoints | Represent specific activities or actions |
| Show progress at a high level | Require hands-on work to move a project forward |
| Have no duration | Have a clear start and end |
| You can mark the completion of major phases | You have to complete each phase step by step |
| Example: “Beta testing completed” | Example: setting up test environments, running tests, fixing bugs |
Let’s understand the importance of milestone charts for tracking, communicating and staying in control of your project.
Why is a milestone chart Important?
A well-optimized milestone chart can help you streamline your project management by driving several benefits to the table. Let’s understand how a milestone chart helps you manage timelines, juggle team responsibilities, improve your decision-making and do more.
Benefits of a well-drafted milestone chart in project management include:
Gives you a clear picture of your project
With a milestone chart, you can see all the important checkpoints at once without digging through complex documents or timelines. Let’s take a milestone chart example where you are using the chart for a website redesign. You can see when your project received design approval and when it’s due for launch. You can also check if there are any special design requests (or feedback) from the client on certain milestones so that you can keep your entire team on the same page from the beginning.
Sets the right expectation for everyone
When key milestones are marked, each one of your team members knows what to expect and when. There is less back-and-forth. For instance, if the chart says “Ad Creatives Approved,” the creative team acknowledges how fast they should work to meet the deadline.
Makes communication easier
According to a study by Deloitte, 31% of project managers struggle to communicate project status to the team. Instead of holding long meetings, you can simply point to the chart. It clearly shows where the project stands and what’s coming next. It also helps your clients or stakeholders get the update without requiring you to explain too much.
Builds a sense of accountability
When milestones are connected to team members or specific departments, it’s easier to hold people accountable. Everyone knows their responsibilities and timelines, which encourages ownership and timely delivery.
All these benefits cease to exist if you don’t know how to create a clearly defined milestone chart for your team. Let’s learn that in the next section.
How to create a milestone chart?
Don’t worry, it’s simpler than it sounds to create a milestone diagram. Whether you’re leading a product launch or managing a complex internal rollout, this step-by-step approach will help you create a clear visual roadmap your entire team can follow.
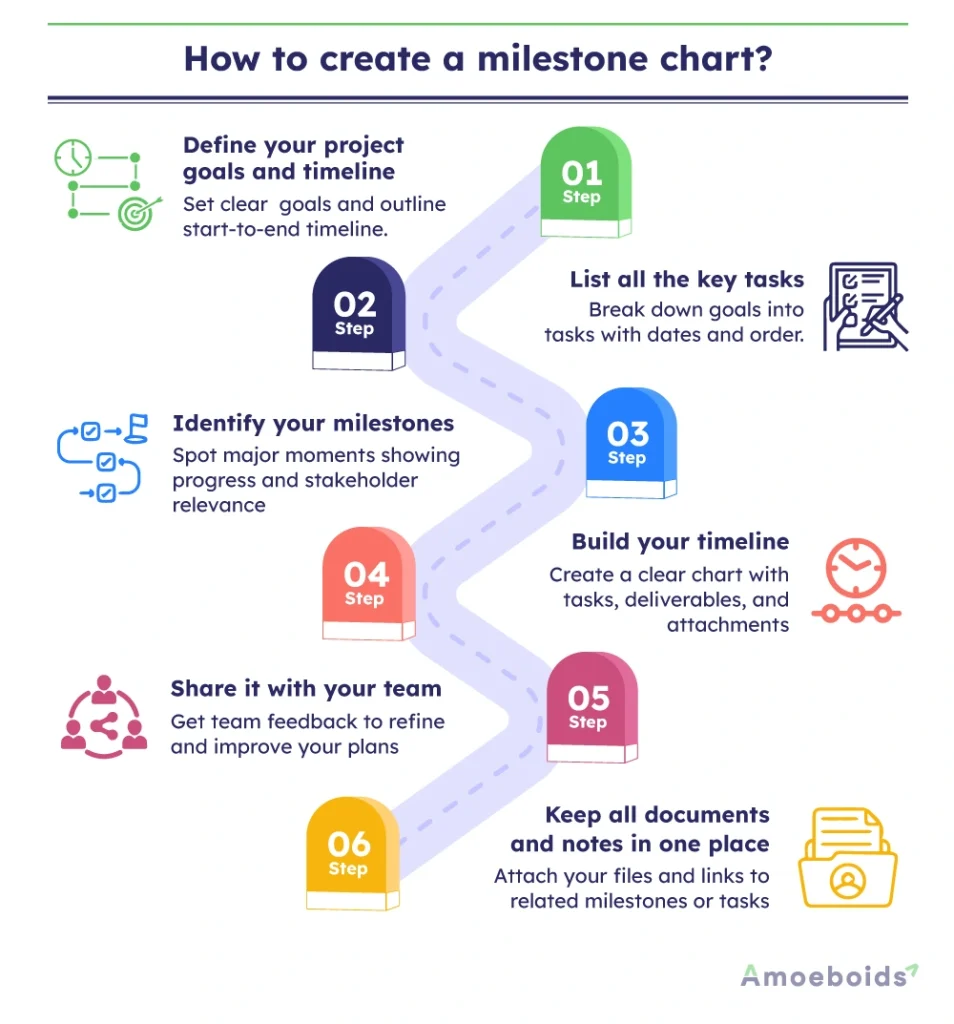
Step 1: Define your project goals and timeline
Define your main objective and lay out a rough start and end date. When people understand the end goal, they’re more likely to stay aligned and motivated.
Example: Suppose you’re leading communications during a company merger. Your goal might be to smoothly transition both companies into one unified brand. Your timeline starts with drafting the internal announcement and ends with a global company event celebrating the merger.
Step 2: List all the key tasks
Once the goal is set, break it down. What needs to happen to reach that goal? Create a task list, putting each item in chronological order. Link tasks to specific dates or time frames. This makes your planning more realistic later on.
Example: Your task list for the merger might include writing the internal newsletter, setting up Q&A sessions with employees, organizing press releases and preparing for the big event.
Step 3: Identify your milestones
Now it’s time to spot the moments that matter. To find milestones, ask yourself:
- Does this point show real progress?
- Does it affect your timeline?
- Would stakeholders care about this update?
- Can the project move ahead without it?
If your answer is yes to the first three but no to the last you’ve got a milestone.
Example: Writing the internal newsletter is a task. Sending it is a deliverable. The moment the newsletter is sent and the company is officially informed of the merger? That’s your milestone.
Step 4: Build your timeline
Now bring everything together. Plug in your tasks, deliverables and milestones on a timeline. Include timeframes, highlight any dependencies (like one task needing to finish before another begins) and check if anything looks rushed or stretched.
Example: You can’t send the press release without getting updated logos from the design team. Mark that as a dependency so it doesn’t slow things down later. Your chart will help make these connections crystal clear.
Step 5: Share it with your team
Once your milestone chart is ready, don’t keep it to yourself. Share it with your team and ask them to check if anything’s missing or needs more time. This is where early feedback can save you from last-minute chaos.
Example: A teammate might spot that you’ve only left one day for Q&A prep which is definitely not enough for such an important session. Fixing that early can save everyone from a stressful rush later.
Step 6: Keep all documents and notes in one place
As your project moves forward, keep attaching important documents, notes and links to the relevant milestones or tasks on the chart. This keeps everything organized and avoids hunting through emails or folders later.
Example: When the marketing team shares the new logo, attach it to the related task. Now everyone has easy access when creating slides, press materials, or emails.
Congrats! Now, you know how to create a milestone chart. Often, you might face some challenges keeping up your speed with the milestone chart. However, they are easy to avoid if you know the best practices.
Best practices for using milestone charts in projects
As you utilize milestone charts more frequently, you’ll adopt some conventions that fit your organization the best. Consider applying some best practices mentioned below to get the most out of your milestone chart.
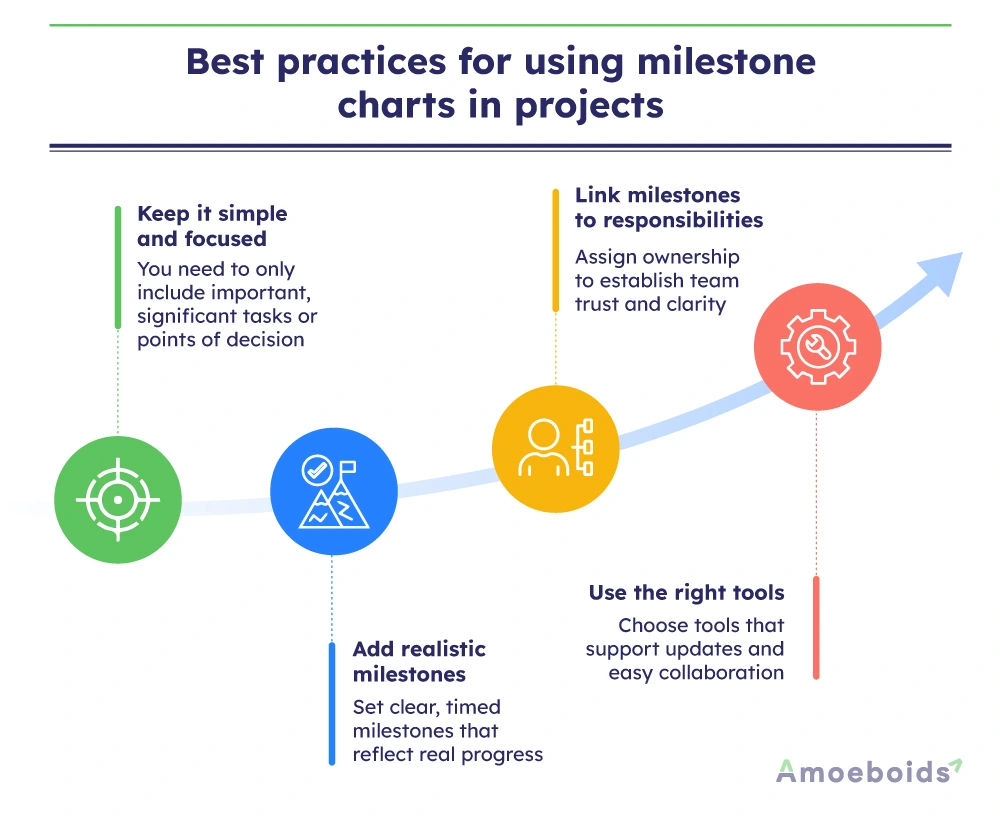
1. Keep it simple and focused
Initially, you may feel pumped up to overload the chart with too many details or minor tasks. Instead, you should only add major moments that signal progress or decision points. Remember the purpose is to keep it simple. In case you feel confused about whether or not to add a task, ask yourself: “Does this move the project forward in a meaningful way?”
2. Add realistic milestones
Also, be realistic with your timelines. Rushed milestones create pressure, and overly spaced ones may slow momentum. Strike a balance based on your project’s pace and complexity. Avoid vague goals like “mid-project review.” Instead, say something like “Client feedback received on wireframes by May 10.” This keeps everyone clear on what exactly needs to happen and when.
3. Link milestones to responsibilities
Instead of just adding milestones, clearly mention who is responsible for each milestone. With this transparency, you can create accountability for team members and clear the air about individual responsibilities in the project.
4. Use the right tools
You can use either a spreadsheet, Gantt chart, or project management software to build the chart. However, make sure the tool is helpful to easily update the chart and share it with everyone involved.
In this regard, a tool like Product Roadmap Portal for Jira Service Management can be helpful. You can pull insights straight from customer feedback and stakeholder requests and build a roadmap from one centralised place. No duplication, no disorganisation. Save hours of labor on wading through mountains of comments and requests from teams, stakeholders and customers.
Conclusion
A milestone chart helps you stay in control of your projects by showing the big picture at a glance. It keeps your team aligned, tracks progress and makes it easy to share updates with others. However, you must be wise enough to differentiate to include only milestones instead of tasks to avoid an overwhelming situation for your team. To create a milestone chart, start from defining your objectives. Break them down into tasks and build milestones from them. Finally, add them into the timeline and share with your team with all documents in one place.
Never forget to involve your team members, key stakeholders and clients into the planning process. If you often feel overwhelmed collecting their feedback on building milestones, leverage Product Roadmap to lead with more clarity, confidence and calm.
Want to further improve your project management capabilities?
Check out other Atlassian apps for project managers from Amoeboids.
FAQs
1. How do milestone charts differ from Gantt charts?
Milestone charts highlight only key events or important checkpoints in a project. Gantt charts, on the other hand, show every task, its duration, dependencies and overall timeline. Milestone charts are more visual and easier for quick progress updates.
2. What is the best software to create milestone charts?
You can use simple tools like Microsoft Excel or Google Sheets for basic milestone charts. For better planning and collaboration, our apps for Atlassian Jira & Confluence offer easy-to-use templates and features tailored for project tracking and milestones.
3. How can milestone charts help in project tracking?
Milestone charts help you see if your project is on track. They show key achievements and deadlines, helping you identify delays early, adjust timelines if needed and keep your team and stakeholders aligned without confusion.
4. What are common mistakes to avoid when creating milestone charts?
Common mistakes include adding too many milestones, being vague with milestone names, ignoring task dependencies, or not updating the chart regularly. Keep your chart focused, clear and realistic so it supports smooth project tracking and better communication.