Every product that gets launched hopes to hit the top spot in its niche or category.
The goal is to outperform its competitors & build massive turnover in a short period.
But how exactly can a company outsmart its competitors and dominate the market?
The secret lies in a well-executed GTM strategy.
Studies show that companies with a well-defined Go-To-Market (GTM) strategy are 30% more likely to succeed.
It’s the game plan that guides a product or service from development to launch. This strategy helps companies understand its audience, manage resources, and reach the target audience effectively.
While we know that a go to market plan is crucial, the burning question is: How do you measure its success?
That’s where this blog comes in.
Here we will look at the top metrics that will help you evaluate the success (or failure) of your Go-to-market (GTM) strategy.
By the end, you’ll know exactly how to gauge whether your strategy is hitting the mark or needs a little tweaking. So, let’s get started and turn those dreams of market domination into reality!
What are go-to-market (GTM) metrics?
GTM metrics are an important part of the go to market strategy.
They help you objectively define the success or failure of the product launch. The key metrics also help in monitoring the ongoing performance of your product or service.
Primary goal of these metrics is to help you make informed decisions regarding the product or service. Whether a pivot is needed or if the problem you are trying to solve is not large enough – you will come to know by tracking one or more of these metrics. They will also help you refine the value proposition of your offering.
We cover 10 such top metric to evaluate your go to market (GTM) success:
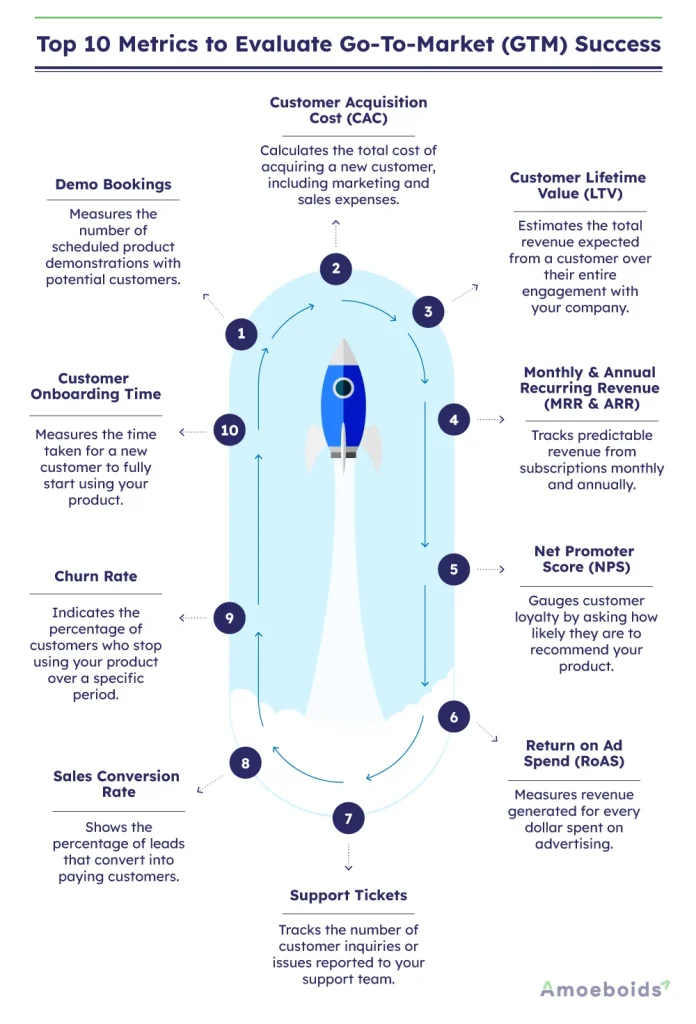
- Demo Bookings – It is the simplest way to gauge interest & engagement from leads. This is the number of scheduled product demonstrations with potential customers.
- Customer Acquisition Cost (CAC) – It is the total cost of acquiring a new customer, including marketing and sales expenses. The formula is (for a given period)
CAC = Total Marketing and Sales Costs / Number of New Customers Acquired - Customer Lifetime Value (LTV) – This refers to the total revenue expected from a customer over their entire engagement with your company. The formula is
LTV = Average Purchase Value x Number of Purchases per Year x Customer Lifespan - Monthly & Annual Recurring Revenue (MRR & ARR) – These are the most common acronyms you would have come across.
Monthly Recurring Revenue (MRR) is the predictable revenue generated each month from subscriptions, while Annual Recurring Revenue (ARR) is the yearly equivalent. The formula is
MRR = Total Monthly Revenue from Subscriptions
ARR = MRR x 12 - Net Promoter Score (NPS) – These metric measures customer loyalty by asking customers how likely they are to recommend your product to others on a scale of 0-10.
NPS = % Promoters (9-10) – % Detractors (0-6) - Return on Ad Spend (RoAS) – This number is the revenue generated for every dollar spent on advertising. The formula is
RoAS = Revenue from Ads / Cost of Ads - Support tickets – Support tickets refer to the number of customer inquiries or issues reported to your support team. This metric tracks the volume and types of customer problems.
- Sales Conversion Rate – Simply put, this is the percentage of leads that convert into paying customers. The formula is
Conversion Rate = (Number of paid customers from leads / Number of Leads) x 100 - Churn Rate – This is a percentage measure of customers who stop using your product or service over a specific period. The formula is
Churn Rate = (Number of Churned Customers / Total Customers at Start of Period) x 100 - Customer Onboarding Time – This is the time it takes for a new customer to go from sign-up to fully using your product. It includes steps like account setup, training, and initial usage.
Knowing the definitions of these GTM metrics is not enough. What’s the importance of tracking them & how to use them while executing your go to market plan?
All that, we cover in the next section.
Why are KPIs/metrics important for GTM strategy?
Below, we double down on the metrics we defined above & point out their importance in the overall GTM plan.
- Demo Bookings – Demo bookings are crucial during the go to market because they represent the first significant step towards converting leads into customers. A higher number of demo bookings suggests that your marketing and outreach efforts are effectively attracting potential customers.
- Customer Acquisition Cost (CAC) – CAC is vital for understanding the efficiency of your marketing efforts. Lowering CAC while maintaining or increasing the number of new customers indicates a more cost-effective go to market plan.
- Customer Lifetime Value (LTV) – LTV helps you understand the long-term value of your customers, informing you about marketing spend and customer retention strategies. A higher LTV compared to CAC indicates a profitable customer base.
- Monthly & Annual Recurring Revenue (MRR & ARR) – Most common acronyms you would hear in the SaaS world. They provide a clear picture of revenue stability and growth potential. Steady growth in MRR and ARR indicates successful customer acquisition and retention.
- Net Promoter Score (NPS) – NPS is a valuable indicator of customer satisfaction and loyalty, which are critical for word-of-mouth marketing and long-term success. A high NPS suggests that customers are happy and likely to refer others, enhancing your GTM strategy.
- Return on Ad Spend (RoAS) – RoAS helps you evaluate the effectiveness of your advertising campaigns. A higher RoAS means more efficient use of advertising dollars. Optimizing RoAS ensures that your marketing budget is being used effectively to drive growth.
- Support Tickets – Monitoring support tickets helps you identify common issues and improve product quality and customer service. Reducing the number of support tickets over time indicates a more user-friendly product and effective customer support.
- Sales Conversion Rate – A vital metric for assessing the effectiveness of your sales process. A higher conversion rate indicates that your sales strategy is working well. Improving your sales conversion rate means more revenue from the same number of leads, enhancing your GTM success.
- Churn Rate – This metric is a key indicator of customer retention. A lower churn rate means more satisfied customers who stay longer. Reducing churn rate is essential for sustaining long-term growth and maximizing customer lifetime value.
- Customer Onboarding Time – A shorter onboarding time leads to quicker customer satisfaction and faster realization of value. Efficient onboarding improves customer experience and increases the likelihood of long-term retention.
Mistakes to avoid while choosing GTM metrics
- The biggest mistake one can make while choosing the GTM success metrics is copying the metrics from a different business. Depending on the goals of your Go to market strategy & the peculiarity of the market – choose what makes sense for you.
- Don’t overload by trying to track too many of these metrics.
- Don’t blindly trust the metrics. Especially, in the initial phase verifying data quality is as important as identifying the metric trends.
- Don’t try to optimize these metrics before achieving Product market fit (PMF).
- Always benchmarks these metrics against competitors before taking important decisions.
Conclusion
In the world of SaaS, there are many more metrics that cannot be listed in a single blog post.
We have tried to list those that are key in the initial phase of go to market execution.
Of course, your product may require tracking a metric that is quite unique to its market. Don’t hesitate in doing that. Ultimately, only you can tell which metrics hold the key to measuring success of your go to market strategy.