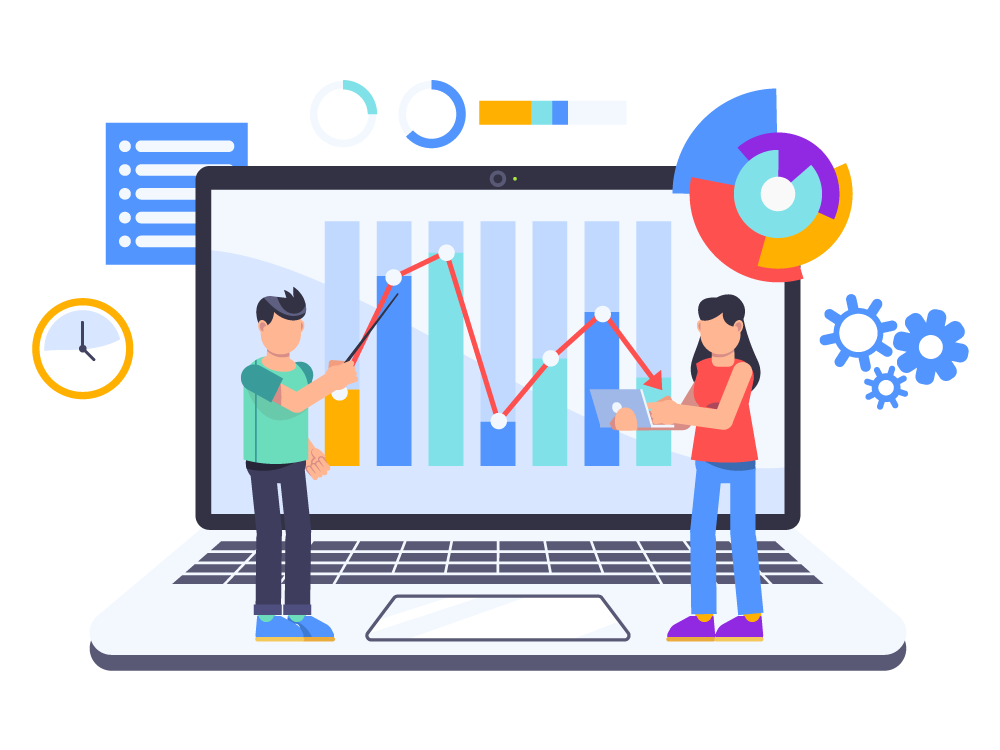
Every business decision starts with data. Raw numbers stored in Excel and Google Sheets may be useful for day-to-day operations. Still, they fall short compared to the optimal performance management offered by modern software solutions. You need a reporting tool that transforms scattered metrics into clear insights that drive action.
The right reporting tools help your business overcome the drawbacks of manual reporting, make the process more efficient, and ensure that all the information you need is always available at your fingertips.
This guide breaks down how the best reporting tools work which types exist, and how to choose the right one. It also identifies the features that set the best apart from the rest, using an in-depth comparison.
What are reporting tools?
A reporting tool, commonly known as reporting software, is one of the most crucial business reporting tools for turning raw data into accessible business reports. Reports can range from sales to management reports and are used across a wide range of industries, including finance, logistics, professional services, and more.
Reporting and visualization of data are necessary parts of an organization’s structure, as they provide the information needed to make key decisions. Thus, choosing the best reporting tool available is a no-brainer for organization of any scale. Gartner also says that 85% of Fortune 500 companies will be using scalable and other data analytics tools in their operations by the end of 2026. It means it is no longer a choice; with growing data and complex operations, reporting tools have become a necessity.
Modern reporting tools are streamlining and automating business tasks that used to require manual oversight, making them the backbone of modern business operational structure. McKinsey reports a 50% reduction in time spent on data tasks through automated reporting tools.
Such tools can connect to databases and provide real-time data at all levels of the enterprise. Modern analytics and reporting tools also help businesses identify trends, improve forecasting, and support faster decision-making. What used to be clusters of numbers can now be turned into actionable insights in real time with reporting tools. There are many more benefits of using a good reporting tool for any organization.
Why Are Reporting Tools Important?
Reporting tools help teams make sense of raw data, which makes it easier and faster to make decisions every day. Companies can track performance metrics, monitor trends, and improve data visualisation with modern analytics and reporting tools.
They also allow for real-time reporting, dashboard creation, and data analysis, allowing teams to remain aligned and focused. Teams can find problems early, see what’s working, and make smarter, data-driven choices with confidence when they can see data more clearly.
What are the types of reporting tools?
While there are many sub-categories of reporting tools, most tools fall into two major domains: visualization tools and analytical tools. Here are some of the top reporting tools that use both visualisation and analytics
Business Intelligence (BI) visualization tools
BI tools are comprehensive platforms that help organizations collect, analyze, and present business data. They focus on transforming raw data into visual formats like charts, graphs, and maps. They often include features for data warehousing, advanced analytics, and reporting, providing a full suite of tools to support decision-making across the enterprise.
Ad hoc reporting tools
Ad hoc reporting tools allow users to create reports on the fly without relying on pre-built templates or IT support. These flexible tools empower business users to generate custom reports to answer specific questions as they arise.
Embedded reporting tools
Embedded reporting tools integrate reporting and analytics capabilities directly into other software applications. This allows users to access reports and insights within the context of the software they are already using, improving workflow and decision-making efficiency.
Sisense and Domo.
There are also operational, strategic, monthly, and enterprise reporting tools, among others, tailored to the different needs of an enterprise. An in-depth comparison will be more helpful for understanding how different tools address different needs.
The benefits of good reporting tools
A good reporting tool can make the difference between making a choice based on actionable insight and data at the right time and waiting till it’s too late.
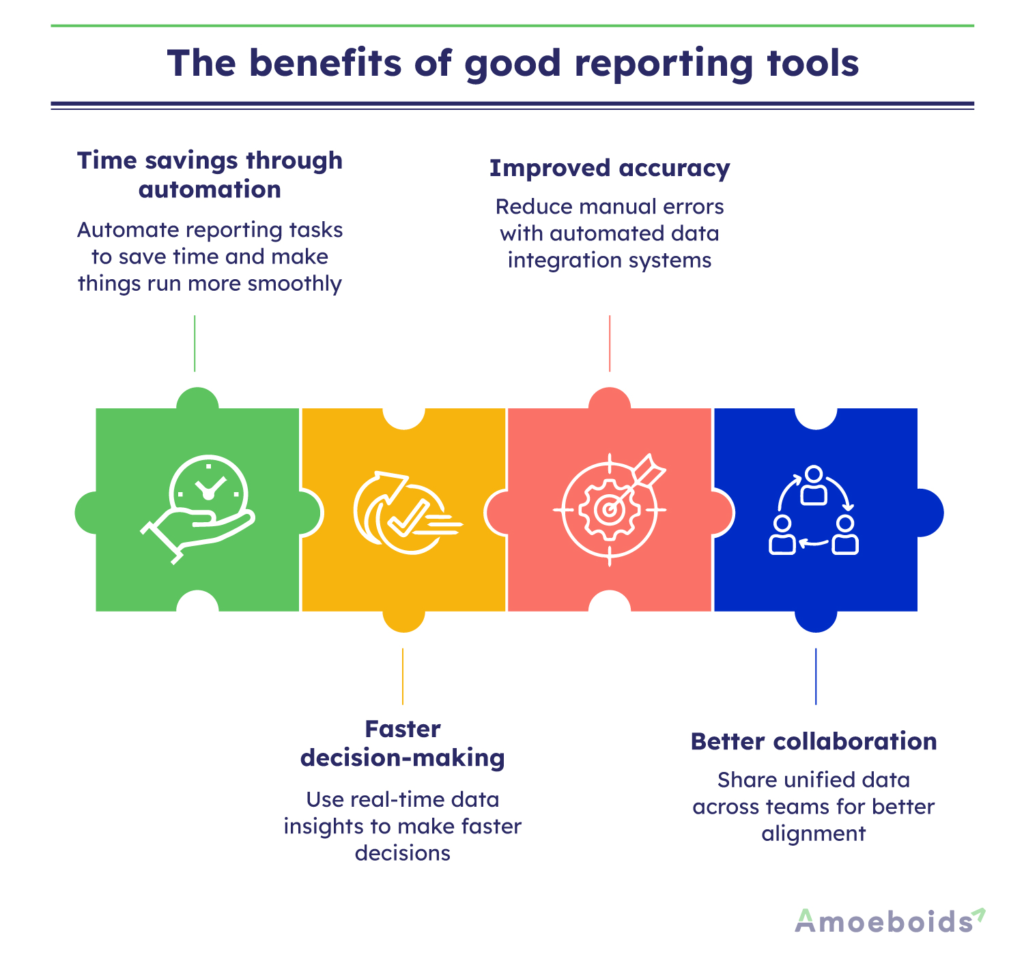
Time savings through automation
Manual reporting consumes 4.1 hours weekly for most teams. That’s over 200 hours annually spent copying data, building spreadsheets, and formatting presentations. But what if the entire process can be automated? Not only will the workload decrease, but work efficiency will increase as well.
Faster decision-making
With real-time data, any issue that requires urgent attention can be spotted before it spirals into a major problem. You always have the data and the necessary insights to make decisions as they come, without waiting days or weeks. Complex data can be visualized when necessary for easy understanding.
Improved accuracy
Humans make mistakes when transferring data between systems. A misplaced decimal or wrong cell reference can corrupt entire analyses. Automated data connections remove this risk by pulling information directly from source systems without manual intervention, reducing it by almost 40%.
Better collaboration
Team reporting tools centralize information access to everyone involved in that operation. Everyone works from the same numbers. Marketing sees the same revenue figures as finance. Sales reviews identical customer data as operations. This prevents unnecessary complications over repeated tasks or misaligned data sharing within the organization and improves the project success rate by 30% according to Gartner.
Choosing an accessible reporting tool is essential so it can be used to its full potential.
Features to look for in a reporting tool
Among countless features that might look useful, there are some fundamental features that you cannot miss if you are looking to use reporting software as your daily driver. The best reporting software should balance usability, automation, scalability, and strong integration capabilities.
Data integration options
Data integration is essential for any enterprise. Before you choose a platform, check all the options it provides for data integration and setup.
Customization flexibility
Pre-built templates speed initial setup, but your business has unique needs. Look for platforms that let you modify visualizations and create your own templates that suit your organization and its members.
Export capabilities
You’ll need to share reports with people who don’t use your platform. Thus, it is important to ensure that reporting software supports multiple export formats, including PDF, Excel, PowerPoint, and image formats.
Visualization variety
Different data types require different visual representations, and the tool you use should be able to provide the best options based on the data it needs to visualize, while ensuring it is easily accessible to everyone using it.
Scalability
When choosing a reporting software, it is important to check whether it can handle the scale of your organization as it grows. Tools with lower future potential will only become a liability in the long term.
How to choose the right reporting tool?
The first step in picking the right reporting tool is to know what your business needs and wants. Look for things like data visualisation, real-time reporting, making dashboards, and easy data integration. The tool should be easy to use, adaptable, and able to handle the amount of data you have.
Also, see if it allows for collaboration and customisation. A reliable reporting tool should help you easily analyse data, save time, and make better decisions without complicating your workflow.
Accessibility of good reporting tools
The best reporting tool means nothing if your team can’t use it. Accessibility determines whether a platform helps you make your daily tasks more efficient or is just a decorative piece with no practical use.
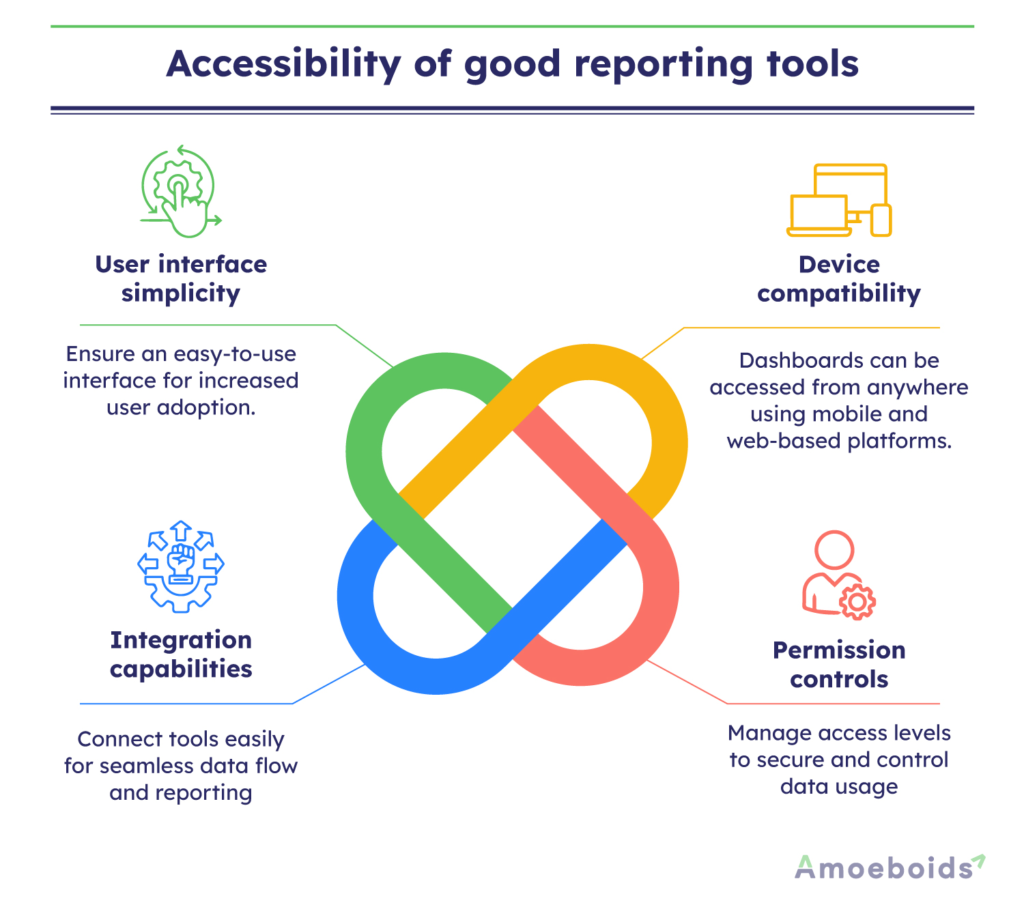
User interface simplicity
Reporting tools should be simple enough for all members of an organization to access. An overly complex interface will look useful only on the surface but will provide no value if most employees cannot understand it.
Device compatibility
Your team doesn’t work from desks alone. Mobile-responsive dashboards and browser-based platforms let managers check metrics from anywhere and eliminate software installation headaches, and ensure everyone can access them at any time.
Permission controls
Different roles need different access levels. Sales teams shouldn’t modify financial reports while external stakeholders might need view-only access. Flexible permission systems available in reporting tools let you control who sees what and who can make changes.
Integration capabilities
A reporting tool that can’t connect to your existing systems creates more work, not less. Thus, it is necessary to check whether platforms offer native integrations with your CRM, project management software, accounting system, and marketing tools.
Accessibility of reporting tools also depends on the type of reporting tool you use.
In-depth reporting tool comparison
Here, we compare some of the best reporting tools available to understand what each provides to its users.
Automated Release Notes & Reports for Jira
ARNR addresses the gap between basic spreadsheets and enterprise BI platforms. Built for teams that need real-time reporting without technical overhead, Amoeboids positions itself among the best reporting software solutions for growing teams.
Key features
● Automated reporting: Schedule reports once and receive fresh data at your chosen intervals
● Custom dashboards: Drag-and-drop interface lets non-technical users build dashboards tailored to their metrics without writing code or requesting IT support.
● Multi-source integration: Connect sales, marketing, and operational data from different systems into unified reports.
● Team collaboration: Share reports, build visualizations together, and maintain consistent data access across stakeholders to speed up decision-making.
Best for: Small to mid-sized teams seeking powerful analytics without enterprise complexity. Organizations need a team reporting tool that scales affordably while maintaining robust functionality.
Pricing: Usage-based model charges for active users and data volume. Includes onboarding support and ongoing technical assistance.
Tableau
Tableau is an enterprise-focused visualization platform for organizations with massive datasets and dedicated analytics teams.
Key features
● Advanced data modeling and complex visualizations
● Handles large-scale enterprise data processing
● Extensive customization options
Best for: Large enterprises with complex data needs and a budget for specialized resources.
Power BI
Microsoft’s BI platform is a reporting tool optimized for Windows environments and for integration with Office 365.
Key features
● Native Microsoft ecosystem integration
● AI-powered analytics capabilities
● Lower entry cost at $10/user monthly
Best for: Organizations are deeply invested in Microsoft products.
Looker Studio
Google’s free reporting platform for basic visualization needs. It is one of the earliest and most used platforms, especially among small and mid-sized enterprises.
Key features
● Zero cost for core functionality
● Simple interface for quick visualizations
● Direct Google Analytics and Sheets integration
Best for: Startups and small businesses with basic reporting needs and Google-centric data.
Conclusion
Choosing reliable business reporting tools helps organizations improve visibility, collaboration, and operational performance. Every reporting tool is different, and the features it provides are, more often than not, targeted at a particular industry or domain. As an enterprise, it is important to ensure that the tool you choose fits all the right boxes for your organizational needs.
The best reporting tool is the one your team actually uses. Fancy features matter less than adoption. Thus, choose something that fits your workflow, not something that requires changing how you work. The best reporting tool will help you:
● Increase efficiency
● Decrease the need for manual oversight
● Provide real-time data access
● Provide streamlined information sharing
For instance, ARNR integrates directly with Jira to streamline project reporting, enabling product managers and technical writers to automatically generate documentation, eliminating repetitive reporting tasks. Book a demo now.
FAQs
What are the desired functionalities of a reporting tool?
Core functionalities include automated data collection from multiple sources, customizable dashboards with drag-and-drop builders, scheduled report distribution, real-time or near-real-time updates, export capabilities to common formats, role-based access controls, and mobile accessibility.
What are reporting tools used for?
Businesses use reporting tools to monitor operational metrics, track project progress, analyze marketing campaign performance, review financial results, manage team workloads, and identify trends in customer behavior. These platforms consolidate information scattered across different systems into unified views that support faster, data-informed decision-making.
What are the desired functionalities of a reporting tool?
Essential functions of a reporting tool vary, but it should include connecting to your existing data sources without extensive technical work, creating visualizations that match your specific metrics, automating report generation and distribution on schedules you define, providing accurate real-time or near-real-time data updates, supporting collaboration through comments and annotations, and scaling as your data volumes and user counts grow.