There are tons of different metrics out there that allow performance tracking of your support team. These metrics help you drill down into the nitty-gritty aspects of the work done for the overall business and its impact on customer experience. Let us explore these metrics in detail to identify the ones which would be more relevant for your teams.
Customer Satisfaction (CSAT)
Method: (Ratings from satisfied customers (4 and 5) / Number of respondents) x 100

This metric is often used to measure how satisfied customers are with the support of the service or product that is provided by the organization. It is usually measured by using variations of the question – How would you rate the support you received? Respondents give an answer that is classified between good, satisfied/meets expectations, and subpar/below expectations. The results can be averaged out to give a composite customer satisfaction score usually expressed as a percentage: 100% being total customer satisfaction and zero percent signifying total customer dissatisfaction. Only responses with the values 4 (satisfied) and 5 (very satisfied) are included in the calculation to predict customer retention, as it has been shown that using the two highest values on feedback surveys provides the most accurate value.
Net Promoter Score (NPS)
Method: Promoters (in percent)- Detractors (in percent) = NPS. Eg:, In a pool of 15% detractors, 10% passives and 75% promoters, the NPS will be 60 (75-15).
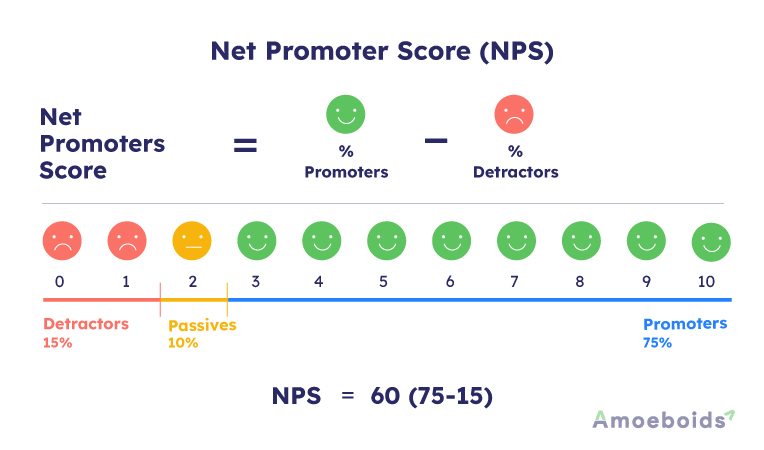
While CSAT is a transactional quality metric, Net Promoter Score or NPS is a more holistic metric designed to measure the customer’s overall experience with the company. NPS asks the question – On a scale of 0 to 10, how likely is the customer to recommend the product/service to a friend or colleague? Those who answer 9 or 10 are considered promoters and brand advocates. Seven and eight are labeled as passives, and the ones who score six and lower are detractors – they’re likely to churn.
NPS is also one of the top GTM (go to market) metrics we recommend you track in the long run.
Internal Quality Score (IQS)
Method: An outcome of category-specific reviews, mentionedin percentage. These ratings are added up and the sum is divided by the number of categories.
The numbers of NPS and CSAT don’t tell the complete story – they reflect how satisfied customers are with the product or service. Customers shouldn’t be the only ones who judge the quality of customer service as they give feedback on the product and company, not just customer service. They don’t see the complex processes behind their inquiries and don’t know the quality standards that organizations follow. They can’t judge how well internal guidelines were followed by the executives when it comes to parameters like the tone of voice, or if the executive provided the best possible solution to the customer’s inquiry. That’s why Internal Quality Score is the third most important customer service quality metric that should be tracked. IQS rates customer conversations from various perspectives, like the executive’s, a peer’s, or a manager’s. IQS is based on rating categories defined by the team or organization, like the solution, tone, and product knowledge. The basic requirement is to have a value that on measurement gives an indication of the quality of service provided or indicates that the conversation with the customer was fruitful. Once the reviewing process starts with rating conversations, tracking the aggregate affects almost all other relevant KPIs and metrics. And by analysing interactions, it is easy to find gaps in a team’s knowledge, which in turn can serve as the basis for improvement in many areas.
Customer Effort Score (CES)
Method: The average of the effort required to get an issue resolved (usually on a scale of 1 to 10).

The Customer Effort Score reflects the amount of work put in by customers to get a resolution to their inquiry. CES is measured by asking customers to rate whether they agree with statements like ‘company A made it easy for me to handle my issue’. The rationale is basically if it is easier for customers to find and do everything they need, the more likely they are to be happy and stick around. By segmenting the customer base or specific product areas, organizations can identify the most challenging parts of customer experience and focus on improving those areas. Combining quantitative and qualitative metrics and looking at the customer experience from both customer and organizational points of view to assure top-notch quality across customer support.
Social listening
Method: Comparing numbers of mentions every month and analyzing them with comments can help managers and teams understand what is going right or wrong.
Helplines are not the only avenues that customers air their grievances. Brands that embrace social media channels and respond back remove a frustrating, one-way experience for the consumer. Tracking social media metrics simplifies responding to a customer, and values like brand mentions over time, negative comments, technical questions, etc.
Operational Metrics (O-Data)
Records of tangible activities that detail win rates, response times, and employee efficiency is collectively termed O-Data, and taking a good look at it can also help in understanding the gaps in support.
First Response Time
Method: First response time – Customer request time = (#minutes/hours/days) first response rate
A Forrester research says that 77 percent of customers return to organizations that value their time. To provide a great customer experience, companies can start by reducing the time it takes for a customer to find a solution to their issues. Customers who reach out for support want a fast reply and solution, preferably from an actual human. It might not be beneficial to send an automated reply that vaguely refers to the activity the customer wanted to accomplish, so providing a fixed time frame to hear from becomes convenient. The usual practices are: About a day for mail or online forms, an hour for social media, and mere minutes if it is through a phone call. If the organization has Live chat and messaging systems integrated for support, they must be near instant.
Overall Resolution Rate
Method: No. of tickets solved / No. of tickets generated = overall resolution rate

The goal is to close the loop when the customer has a question or complaint and resolve the issue. If adequate support can’t be provided within an expected timeframe, the customer may not come back. As resolution rates rise, it is safe to assume that the customer support team is efficient and effective. Even in such cases, taking feedback from customers is extremely important. To make the process more conversational and engaging, Teams can use various tools such as Typeform integration for JSM to craft meaningful questions and take exact user feedback.
First Contact Resolution Rate
Method: Resolved incidents on first contact / total no. of incidents
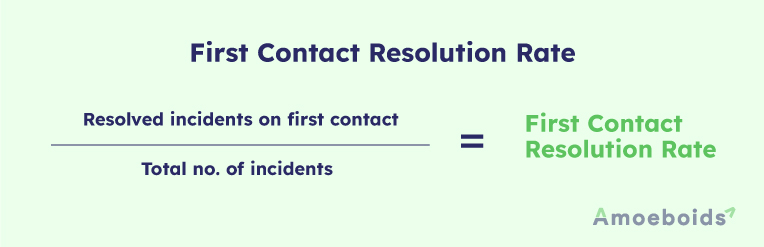
Customers want to be done with their support requests, chats, or calls – and if they’re bounced around from agent to agent, they would want to move on to some other service provider or product. By measuring the first contact resolution rate, organizations can understand if their customer is spending less effort while getting their queries resolved. If the number is 1 (meaning the query was sorted in only 1 call), the resolution rate of first contact is extremely good. Tools like Screenjar help in improving this number, with very little effort on both support and customer side. With just a click, customers can attach screen recordings of the problem they are. Concerned teams can act quickly, as they have relevant details regarding the problem.
Customer Ticket Request Volume
Method: Comparing support ticket volumes over a predefined period of time (month, week)
Having a functional ticketing system that customers use regularly is a boon for developers until the channels get flooded during a new launch or feature change. Rising number of tickets means the organization needs to hire more customer support agents, or find ways to solve issues faster. Particular attention should be paid if the number of tickets spikes after a major event (like a product launch or feature release).
To conclude, among the multitude of options shared above, the focus should be on the ones that actually matter and help ensure that the customer support quality is top-notch.