
Weekly Customer
Support Report
Turn a week of support tickets into one clear report,
ticket volume, agent performance, SLA breaches, and
satisfaction, ready before Monday's support review.
What is a Weekly Customer Support Report?
A Weekly Customer Support Report gives a clear view of weekly ticket volume, status, agent performance, SLA compliance, customer satisfaction, and reported issues in Jira.
Unlike an engineering-facing report, this one is built around support operations: how many tickets came in, who handled them, whether response and resolution targets were met, and how customers rated the experience. It answers the question a support lead needs every Monday: how did the team actually perform last week, and where's the risk building up?
Who should receive it?
Anyone accountable for support quality, staffing, or customer experience.

Support managers
Use it as the standing weekly review of team performance and SLA health.

Customer success leads
Track satisfaction ratings and recurring issues that could signal churn risk.

Team leads / agent managers
Compare created versus resolved tickets per agent to spot workload imbalance.

Leadership
Wants a quick read on SLA compliance and satisfaction trends without digging into the ticket queue.
When should it be sent?


Weekly, on a fixed day
the report's own format assumes a recurring Monday-morning review

When SLA breaches spike
to catch a first-response or resolution-time problem before it becomes a pattern

After a rough week
to document what happened and why, with data instead of anecdotes

Before a staffing conversation
agent-level created/resolved/pending numbers are the input a capacity decision needs

When a customer satisfaction dip
needs explaining
the reported issues log usually shows what drove it
Essential sections, with examples
Six sections, moving from the headline number to the detail behind it.

Executive Summary
Total tickets for the period and a breakdown by status, the one number a leader actually needs before anything else.
Example:
17 total tickets · To Do: 8 · In-Progress: 4 · Done: 5

Ticket Overview
Total tickets again, broken down by issue type and by affected component, so the reader sees what kind of work drove the week's volume.
Example:
Bugs: 9 · Feature Requests: 5 · Support: 3 · Onboarding: 9 issues, the most of any component

Agent Performance
Per-agent counts of tickets created, resolved, and still pending, the section that shows workload distribution across the team.
Example:
Agent 1, 8 created, 5 resolved, 3 pending

SLA Performance
Breached versus not-breached counts for time to first response and time to resolution, the clearest signal of whether the team is keeping pace.
Example:
Time to First Response, 9 breached, 8 not breached

Customer Satisfaction Ratings
A star-rating distribution across resolved tickets, giving a direct read on customer sentiment, not just operational throughput.
Example:
4 Star: 3 tickets · 3 Star: 2 tickets · 1 Star: 0

Reported Issues
A full log of the week's tickets with key, type, summary, reporter, assignee, and status, so a reader can trace any number above back to the actual ticket.
Example:
BLS-2, Incident, "Unable to login with Google auth," reported by Jane Smith, assigned to John Doe, Work in Progress
Common mistakes

Leading with the ticket log instead of the summary
A reader shouldn't have to scroll through 17 rows to find out how the week went.
Reporting SLA numbers without context
"9 breaches" means little without knowing that's higher, lower, or in line with a normal week.
Averaging agent performance instead of showing it per agent
A team-wide resolution rate can hide one agent carrying a disproportionate pending load.
Skipping satisfaction ratings when they're low
Leaving out a bad week's CSAT numbers to "keep things positive" removes the one signal that predicts churn.
No component or issue-type breakdown
Volume alone doesn't tell you if bugs are trending up or if it's mostly routine support requests.
Inconsistent reporting windows
If the reporting period isn't stated clearly, week-over-week comparisons stop being reliable.
Example report
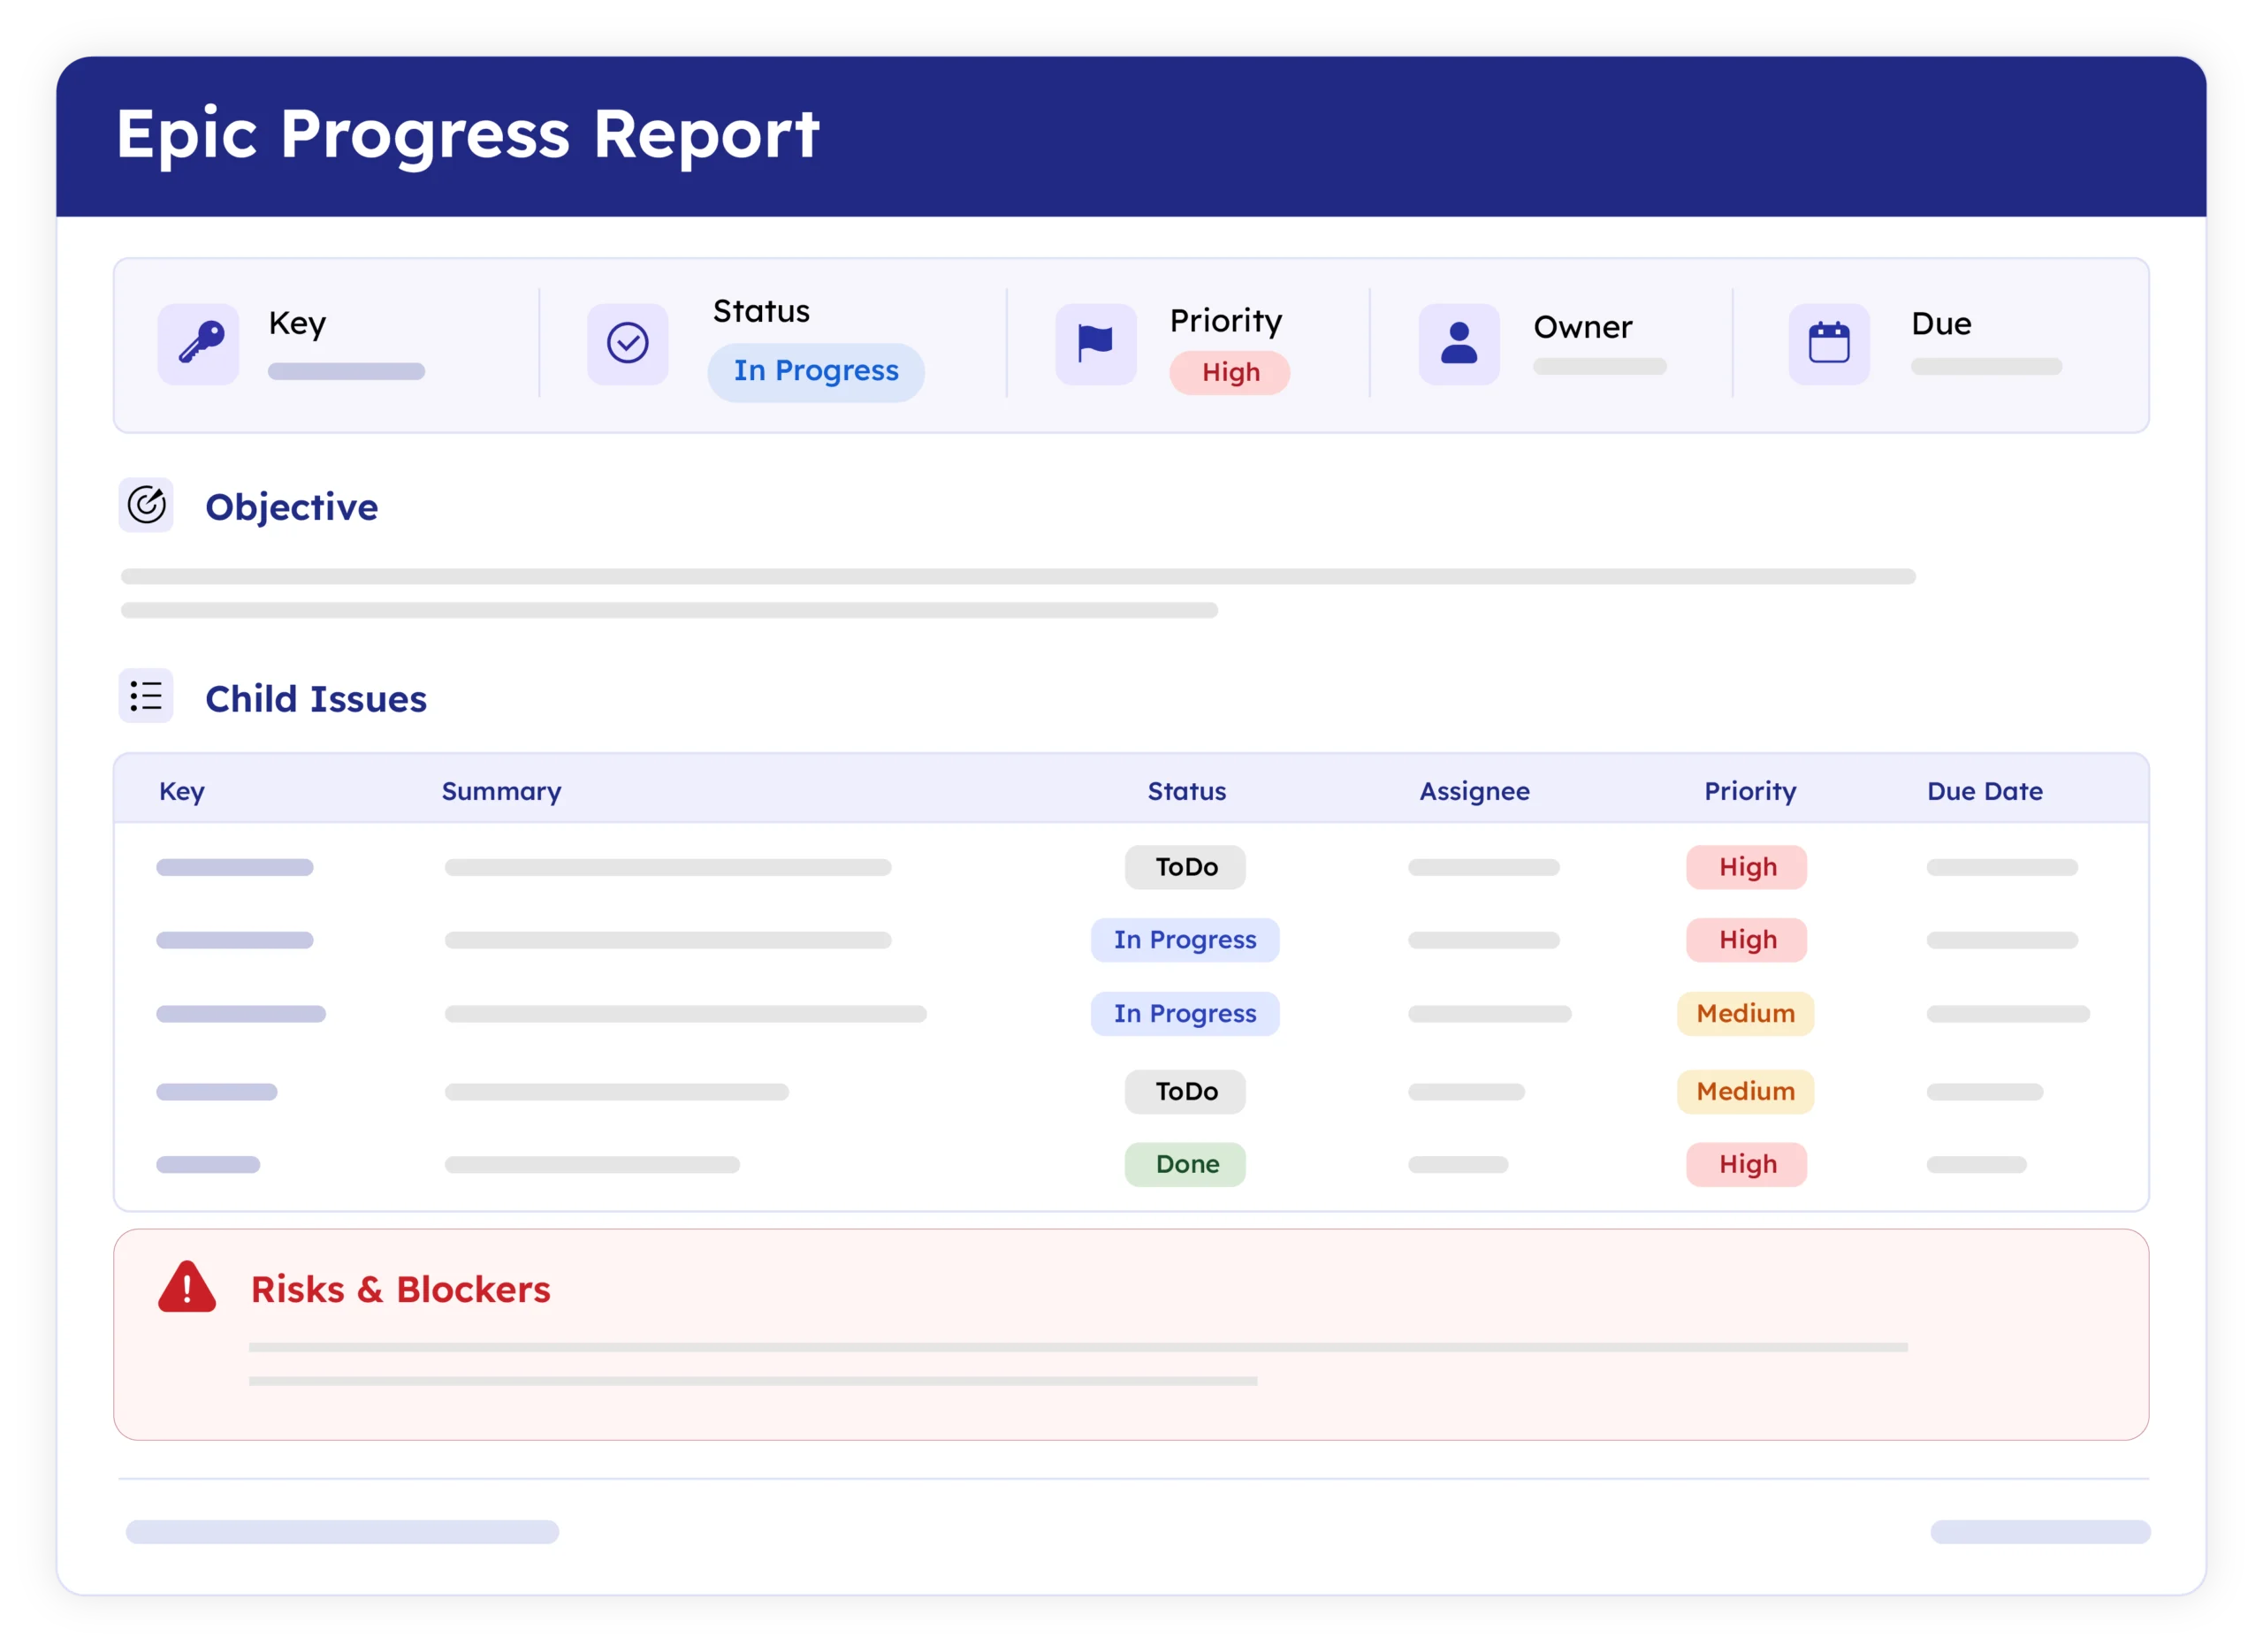
A real report, recreated here from live Jira data. Swap in a full screenshot once the final export is ready.
How to automate it with ARNR
Three steps replace the Monday-morning ritual of pulling ticket data manually.
Connect Jira
Link your Jira project to ARNR. It reads tickets, agents, and SLA data directly.
Pick the reporting period
Choose the week (or any custom date range) and select this template from the library.
Get your report
ARNR calculates SLA breaches, agent performance, and satisfaction ratings automatically, then hands you a PDF or a live link to share.
Related report templates

SLA Report
response and resolution

Weekly Status Report
General Team update

Customer Updates
External comms

Risk Report
Deep dive