Every Jira project (or Space, as it is called these days) has a pulse.
Right now, as you read this, somewhere a ticket is moving from “To Do” to “In Progress,” a new bug is being reported, or a sprint deadline is getting closer. As work keeps moving, staying on top of every update becomes a challenge.
Every Monday starts the same for many teams. They switch between boards, reports, and filters to check sprint progress, open bugs, release status, and support tickets. By the time they piece everything together, valuable time has already been lost.
Now multiply that across every team in the company.
Scrum masters, QA leads, project managers, and release managers are all searching for the information they need but in different manifestations. The information exists, but getting a complete, real-time view needs some digging in.
The solution is having one place where the right information is always available, for that persona. That’s when the idea of a Jira Dahsboard starts making sense.
A Jira Dashboard brings your most important project data into a single, customisable but tailored view, helping teams monitor progress, identify issues quickly, and make informed decisions with confidence.
In this blog, you’ll learn what a Jira Dashboard is, why it matters, how to create one, and explore nine practical examples to help you build dashboards in your Jira that work for your team.
What is a Jira Dashboard?
A Jira Dashboard is a visual representation of your projects in Jira to surface all the necessary details for the specific audience to assist them in quick decision making, rather than forcing them to go through a pile of data. The dashboard is based on data from your Jira projects and summarises it or aggregates it using visual gadgets such as charts, lists, and reports.
No need to open multiple boards or dig through issues to see sprint progress, open bugs, task status, team workload, and more – a properly created Jira Dashboard will have all necessary info in one place.
Good thing is that Jira allows different teams to create dashboards based on their needs, whether for developers, project managers, or executives. Also important to note here that dashboards in Jira update automatically as underlying work items change. This provides your team with real-time project insights that don’t require manual reports or spreadsheet updates.
Why is a Jira Dashboard Important?
Jira Dashboards simplify tracking project progress by combining key data, workflows, and progress, helping teams monitor work and make faster decisions. You can easily see the sprint progress, open bugs, team workload, and project status all on one page instead of opening hundreds of issues or multiple project boards. This saves time and keeps everyone working with the same up-to-date information.
Jira dashboards are automatically updated, so teams don’t have to rely on outdated reports or status emails. It also helps managers identify risks, solve problems faster, and make informed decisions. When referring to these overviews, meetings are more productive, as they already have the up to date project data.
What Makes a Good Jira Dashboard?
A useful Jira Dashboard isn’t about adding as many gadgets as possible. It’s about showing the right information to the right people.
A properly created dashboard should help users find what they need in just a few seconds. If it’s confusing or filled with unnecessary gadgets, people are less likely to use it.
Your dashboard in Jira requires regular upkeep to reflect the changing dynamics of the target audience. You need to remove gadgets that are no longer useful, add new gadgets that improve productivity, update filters, and adjust the layout as your projects change.
Most importantly, create dashboards keeping in mind your target audience. Developers, project managers, and executives all need different insights, so one dashboard almost always does not work for everyone.
Who Uses Jira Dashboards?
Different teams use Jira dashboards in different ways. Scrum Masters track sprint health, a Product Manager’s responsibility may need them to track progress on the roadmap, QA teams track bugs, and a Release Manager’s role may demand them to track upcoming releases. Jira Administrators monitor system performance, while executives, marketing, and support teams use simplified dashboards to turn technical work into business insights.
Creating a dashboard in Jira with endless gadgets may be tempting, but each role requires a different perspective. So understanding the primary needs becomes important before you even build one.
Key Components of a Jira Dashboard
Another thing that you need before you cook up a dashboard in Jira, is the key ingredients that make up for this useful recipe. Here are five core components of Jira dashboards in brief.
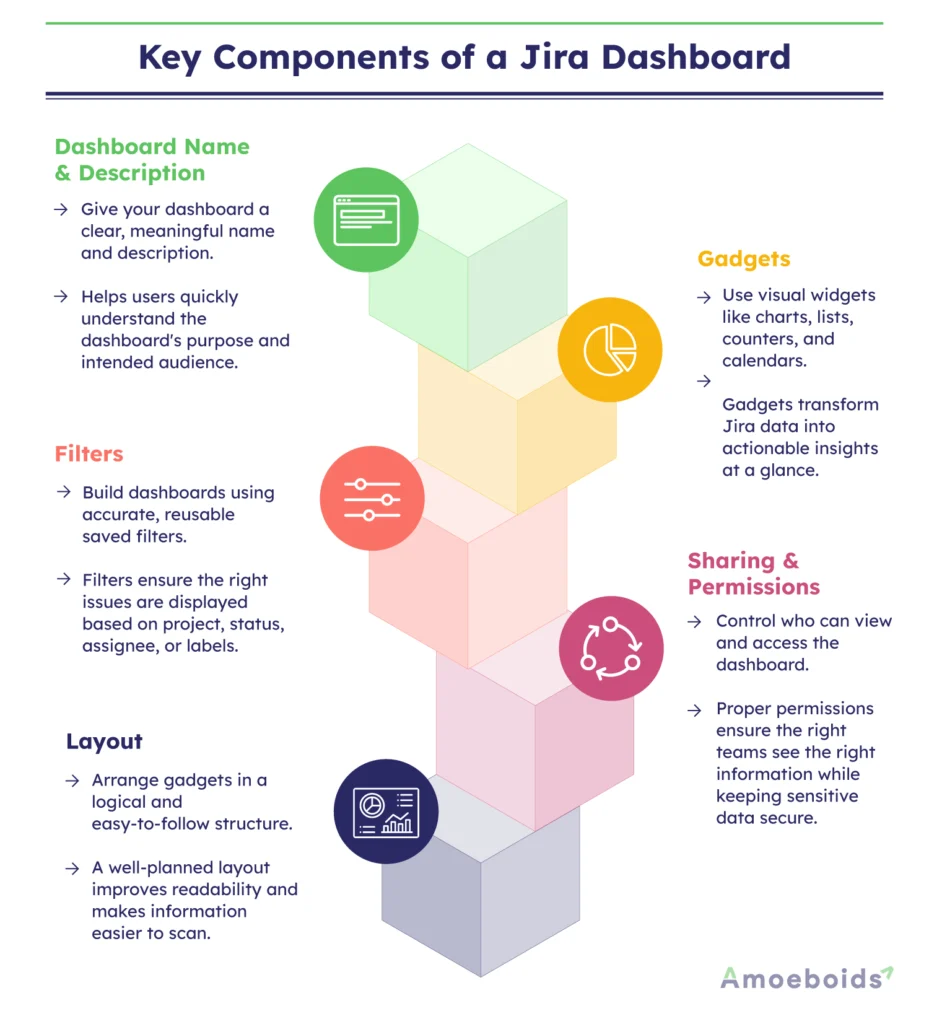
Dashboard Name & Description:
Every dashboard should have a clear name. A vague name can confuse users and make it harder to find the right dashboard. Choose a descriptive name that clearly explains its purpose.
For example, “QA Sprint Health” is much more meaningful than a generic name like “Dashboard 3”
Also, don’t ignore the description field. Use it to explain what the dashboard is for and who should use it, making it easier for everyone to find the right information quickly.
Gadgets:
The visual components of the screen are gadgets. Think charts, lists, counters, and calendars, each based on a specific filter or data source. This is where the real substance resides. Getting the right mix is key to making something that people will actually use.
Layout:
Jira lets you arrange gadgets across different column layouts. A thoughtful layout brings related information together. The eye naturally moves from the big picture down to the details, rather than bouncing around the screen.
Filters:
Most dashboard gadgets use saved filters to display the right information. These filters decide which issues appear based on details like project, status, assignee, or labels. Creating clear and structured filters helps your dashboard remain accurate, useful, and easy to maintain over time.
Sharing & Permissions:
You can keep a dashboard private, share it with your team, or make it available to everyone in your company. Choose the right access carefully so the right people can view the right information.
Pro tip: If your team relies on Jira for release management, consider extending your dashboard with the Automated Release Notes and Reports app for Jira. It adds release calendars, release readiness views, and automated reporting to the standard gadgets in Jira, giving teams better visibility going beyond what native Jira dashboard gadgets offer.
Types of Jira Dashboards
Jira supports a wide range of teams and projects, so dashboards are created differently based on each team’s goals and responsibilities.
- Software projects: Track sprint progress, code reviews, open bugs, and delivery timelines. Dashboards for software projects cater to the SDLC specific workflows & process needs.
- Business projects: Marketing, HR, finance, and operations teams rely on dashboards to monitor tasks, approvals, and project milestones. They enhance visibility in non-technical workflows and team collaboration.
- IT Service Management (ITSM): Check incident resolution, SLA compliance, ticket backlogs, and service performance. Teams can quickly identify recurring issues and provide consistent service quality.
- Product management: Track roadmap progress, feature development, customer feedback, and release readiness from a single screen. The Roadmap & Idea Portal for Jira Service Management app can help you and your team to prioritise ideas and align roadmap planning with customer needs.
- Customer Support / JSM: Track ticket volume, response times, resolution rates, and customer satisfaction trends. Support managers use these insights to balance workloads and improve service quality.
It’s the same underlying tool. But the priorities & goals are simply not the same. The gadgets, filters, and framing are all customised to the team’s specific needs.
Common Jira Dashboard Gadgets and the Metrics They Track
Picking the right gadgets is what separates a useful setup from a wall of charts nobody understands. Here are five you’ll see constantly.
Filter Results (Saved Filter Issue Lists)
This gadget displays a live list of issues based on a previously saved JQL filter. It’s ideal for situations like “all open bugs assigned to me” which results in a simple list of issues with specific columns to appear within the gadget.
Two-Dimensional Filter Statistics
This one compares two data points to each other, such as status versus assignee. It provides a matrix view that is perfect for detecting workload imbalances promptly.
Issue Statistics
This gadget breaks down issues by a filter of your choice and displays distribution by priority, type, or status. You can easily see exactly where your team’s energy is going.
Pie Chart
A quick visual representation of the issue type or status. It’s a good way to express proportions without forcing people to read raw numbers.
Sprint / Burndown Gadgets
These track velocity and cycle-time trends across a sprint. They help scrum masters and product managers see if the team’s pace matches its commitments.
Many teams also use Atlassian marketplace apps to enhance Jira dashboards and gain deeper insights than possible through native Jira dashboard gadgets.
Steps to Create an Effective Jira Dashboard
Creating an effective Jira Dashboard does not have to be difficult. With a few best practices, you can create one that your team will use every day.
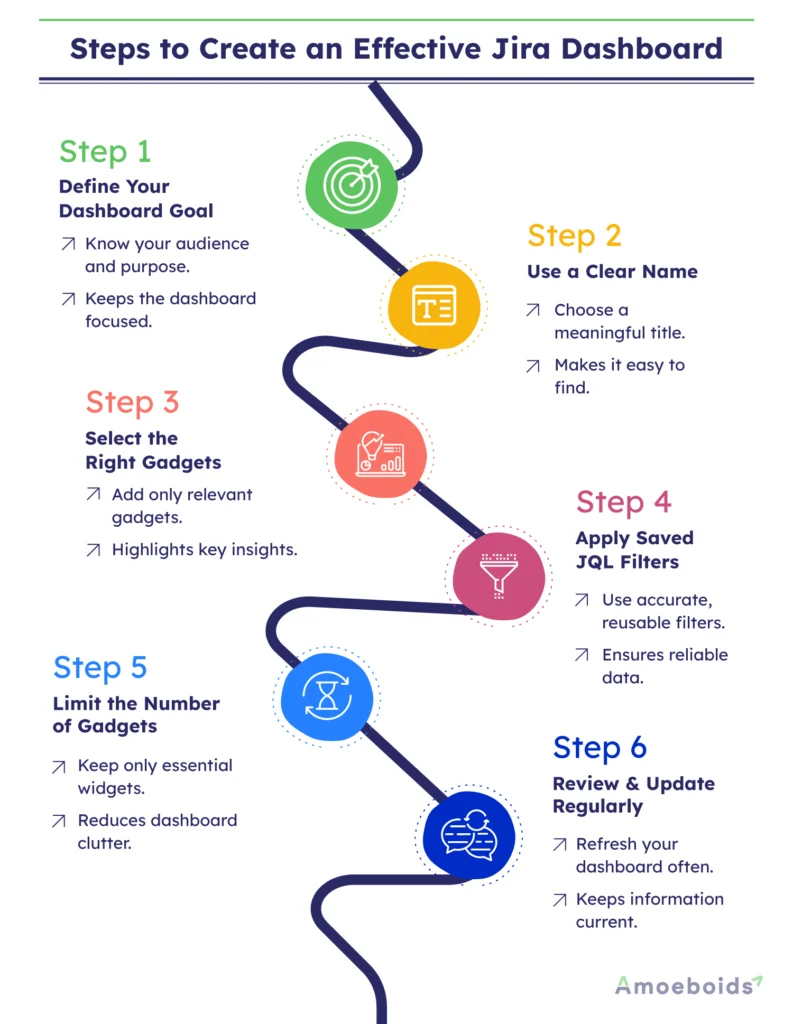
Step 1: Define your dashboard goal
Identify who will use the dashboard and the decisions they want to take based on this dashboard. A clear purpose allows you to select the appropriate data and avoid adding unnecessary gadgets.
Step 2: Use a clear name
Give your dashboard a clear name that immediately tells what it does. A clear title helps teammates locate and use the right dashboard.
Step 3: Select the right gadgets
Choose gadgets that are directly related to the purpose of your dashboard. You should be able to get useful insights from each gadget so users can focus on the important information rather than metrics that don’t matter.
Step 4: Apply saved JQL filters
Create accurate and relevant data with clear and reusable JQL filters. Accurate filters keep dashboards focused on the right information & ensure that users always take calls based on correct data.
Step 5: Limit the number of gadgets
Add only the gadgets required to convey important insights. This ties back to the 1st step. You can limit the number of gadgets only when you have clarity around the goal of this dashboard.
Step 6: Review and update regularly
As projects, priorities, and teams evolve, revisit your dashboard. Remove outdated gadgets, refresh filters, and change layouts to keep the dashboard accurate, relevant, and useful.
Jira Dashboard Best Practices
Once a Jira dashboard is live, a few simple habits will keep it valuable rather than allowing it to deteriorate over time.
- Show relevant data: Every gadget should earn its place by answering a question that someone on the team has asked.
- Detect data problems: A good setup also functions as an early-warning system. If a gadget suddenly returns no results, something has most likely gone wrong.
- Separate dashboards by audience: Resist the urge to create a single screen for everyone. A developer-focused and an executive-focused perspective rarely overlap.
- Prune unused gadgets: If nobody’s referencing a gadget anymore, remove it. A leaner layout is simply a faster, more trustworthy one.
- Use favorites and subscriptions: Make a habit of favoriting the views your team uses the most. Configure email subscriptions for those that require regular eyes without anyone logging in.
Common Jira Dashboard Mistakes
Even experienced teams can fall into the same traps.
- Too many gadgets: Cramming twenty gadgets onto one screen doesn’t make it more useful. It just makes it exhausting to look at. People stop opening it when it feels like too much effort.
- Irrelevant metrics: Data that doesn’t lead to a real decision isn’t harmless. It’s just noise, and it’s taking up space. Eventually it buries the numbers that do matter under charts no one asked for.
- Outdated filters: A filter built six months ago for a completed project will quietly feed the view incorrect data. Nobody notices until a decision is made based on numbers that were never correct.
- Mixed audiences: Trying to satisfy developers, product managers, and executives on one screen usually leaves all three unsatisfied. Each group ends up scrolling past gadgets meant for someone else entirely.
9 Jira Dashboard Examples for Different Use Cases
Enough of theory. Let’s get practical. Here are nine setups customised to specific roles, along with the gadgets and metrics that make them work.
1. Jira Dashboard for Release Managers
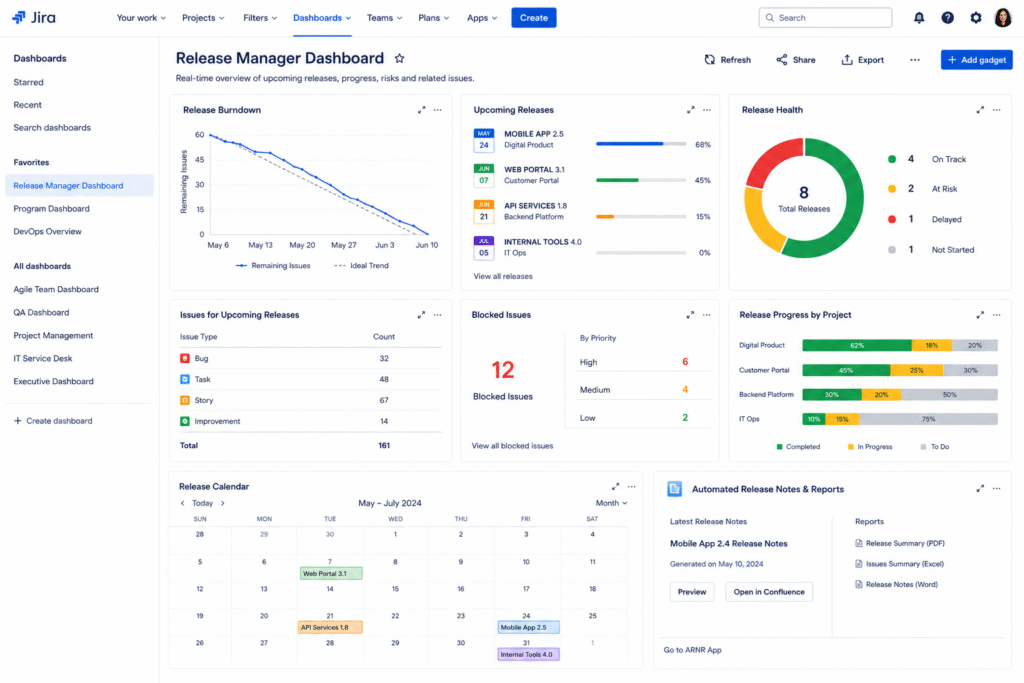
Release managers need a clear view of upcoming releases, timelines, and key milestones to keep delivery on track. This dashboard brings all the important release information together in one place. One of its most useful features is the Release Calendar, which shows upcoming releases and milestones for multiple projects in a single view.
This makes it easier to monitor release schedules, coordinate teams, and identify potential delays early.
Many teams also use the Automated Release Notes and Reports app for Jira to automatically create release notes from resolved issues, reducing manual work and saving valuable time.
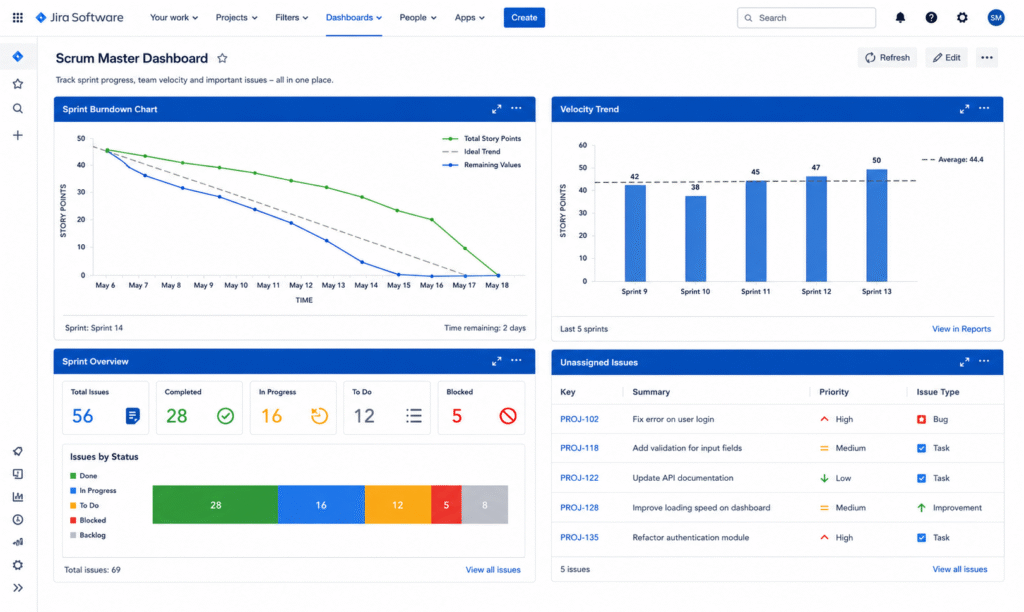
2. Jira Dashboard for Scrum Masters
Scrum masters need a clear view of sprint progress to keep the team on track. This dashboard brings together the most important sprint metrics in one place.
A Sprint Burndown Chart shows how work is progressing, while a Velocity Trend gadget highlights changes across recent sprints. A Filter Results gadget is also used to find unassigned issues before they get lost. Stand-up meetings become more focused and productive when all of the important updates are displayed in one place.
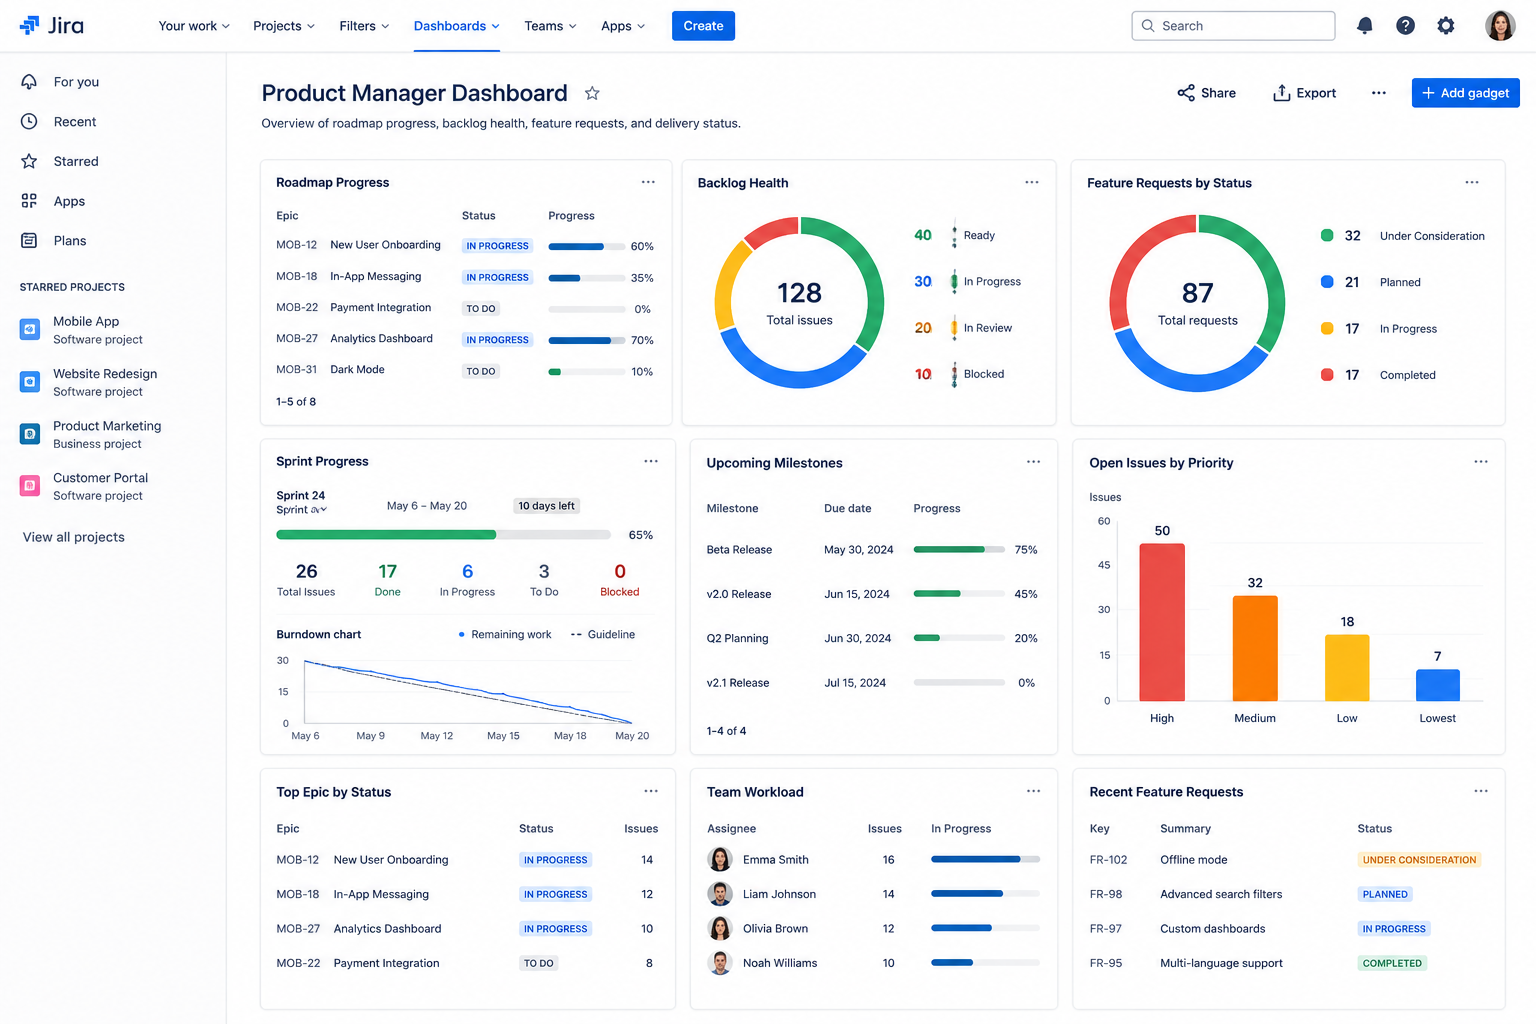
3. Jira Dashboard for Product Managers
Product managers handle roadmaps, backlogs, feature requests, and stakeholder priorities every day. This dashboard offers them an end-to-end view of the product progress without switching between various Jira boards. It includes roadmap progress, backlog health, feature status, and issue distribution, helping teams track progress and identify priorities effectively.
Gadgets such as Pie Charts and Two-Dimensional Filter Statistics make it easier to analyse work across epics and statuses. With everything in one place, product managers can confidently prioritise features, track delivery, and make informed decisions.
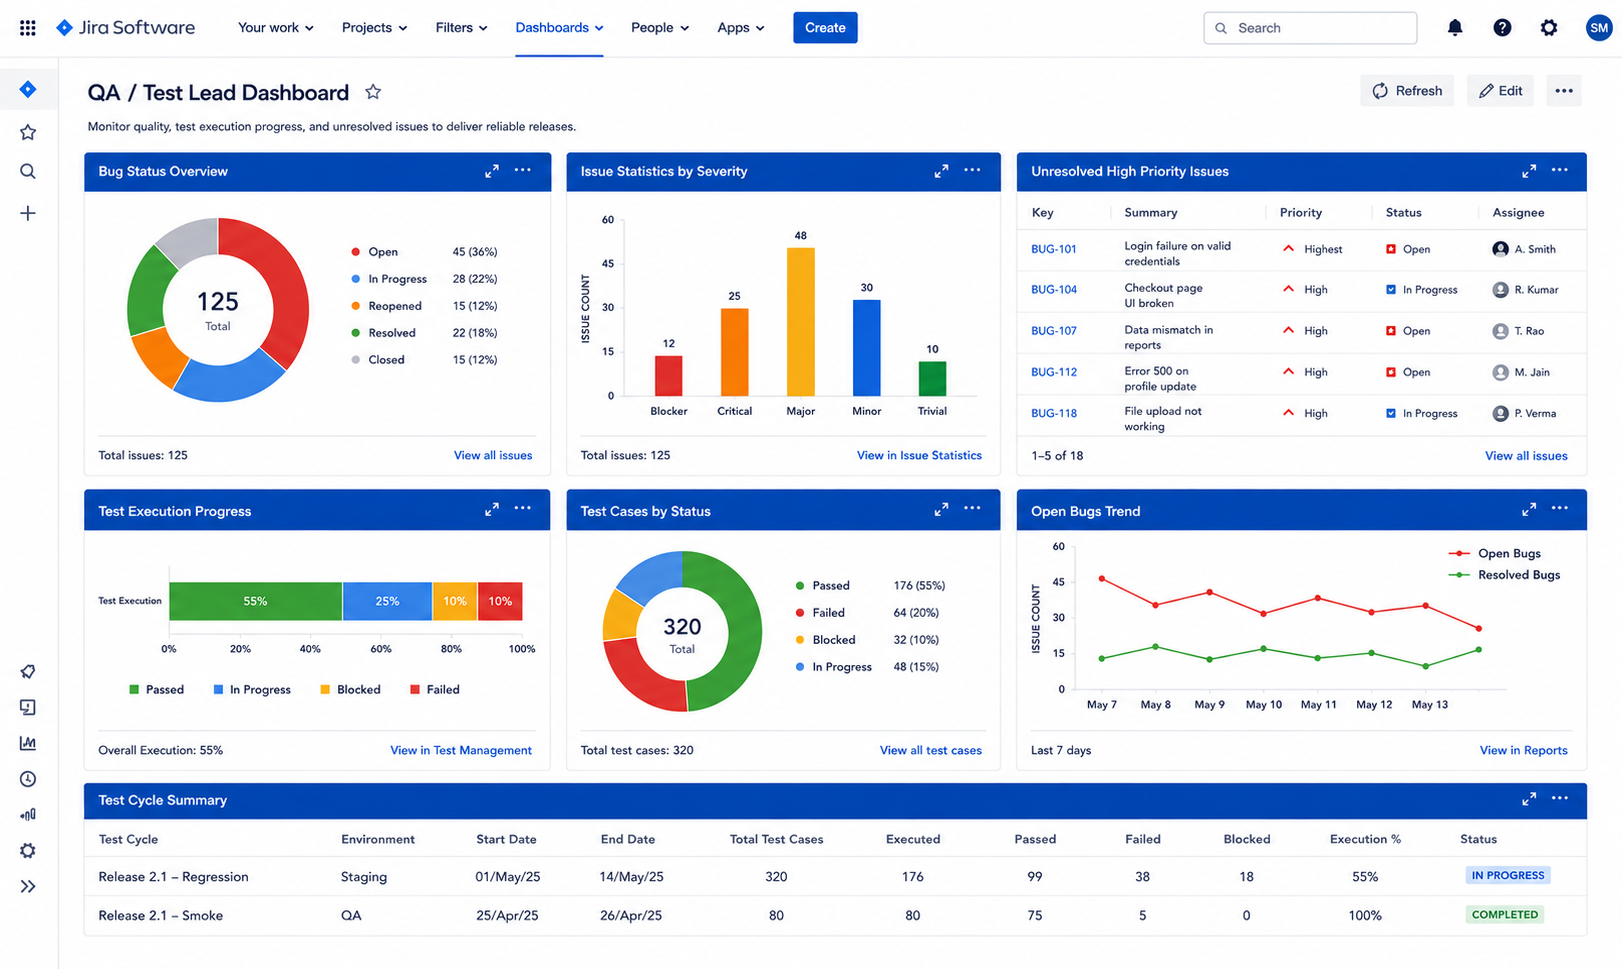
4. Jira Dashboard for QA / Test Lead
QA teams verify that every release meets quality standards before it reaches customers.
This dashboard helps test leads & managers monitor bug trends, testing progress, and unresolved issues from a single screen. Issue Statistics gadgets sort bugs by severity, and Filter Results highlight important issues to address.
Test execution or completion gadgets give a clear picture of testing progress before release. Bringing quality metrics into one dashboard helps QA teams identify risks, improve collaboration, and deliver release-ready software confidently.
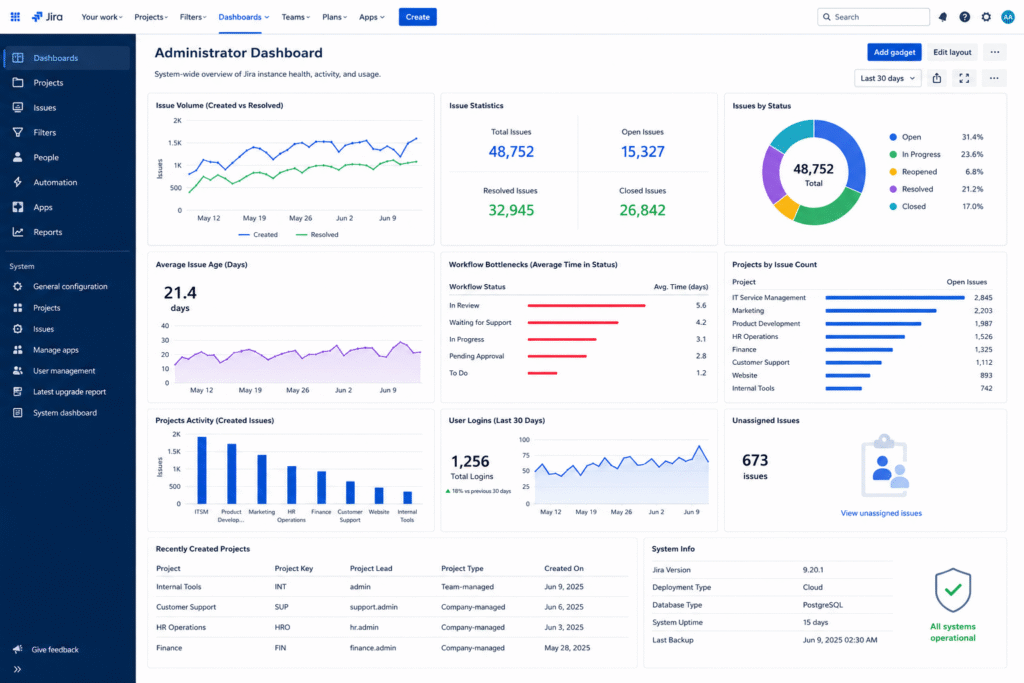
5. Jira Dashboard for Jira Administrators
Jira administrators are responsible for keeping Jira structured, effective, and reliable for every team. The dashboard is focused on system-wide activity, not individual projects. It tracks workflow bottlenecks, issue aging, project activity, and overall usage trends to help administrators maintain a stable Jira environment. Gadgets that monitor issue volume and workflow performance can help detect configuration issues before they affect users.
Administrators with better visibility into the Jira instance can improve performance, simplify maintenance, and provide more effective support to teams.
6. Jira Dashboard for Engineering Leads
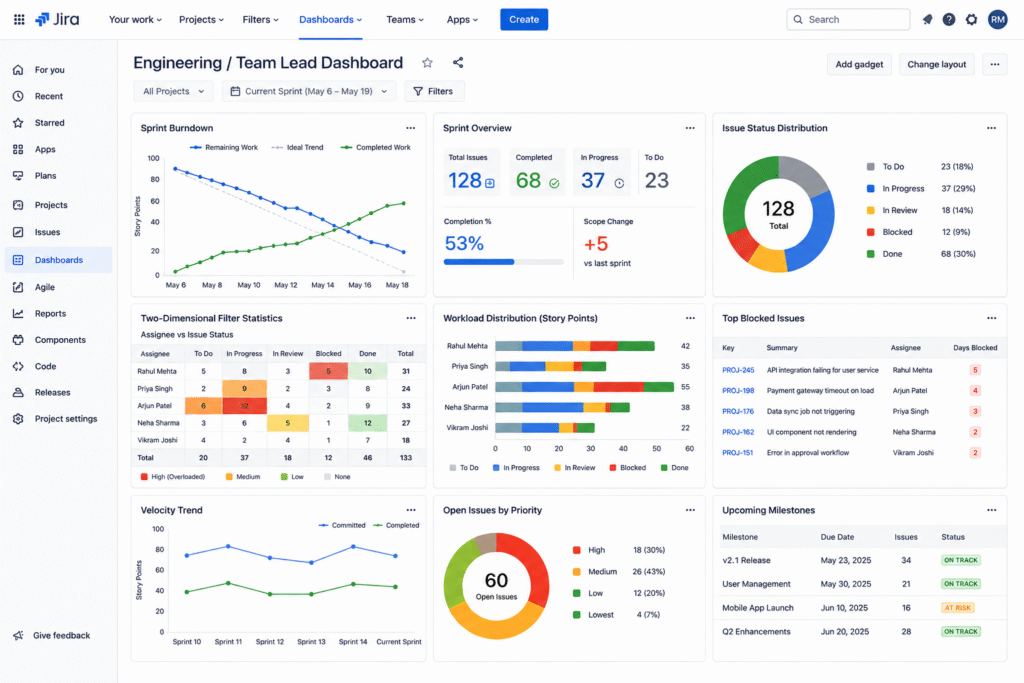
Engineering leads need visibility into both project progress and team workload to keep delivery on schedule. This dashboard combines sprint metrics, issue status, and workload distribution, helping teams monitor progress and improve sprint execution efficiently. Two-Dimensional Filter Statistics compare assignees based on issue status, allowing leaders to identify swamped team members or blocked work early.
When engineering leads track team capacity and project health together, they can balance workloads, clear bottlenecks, and keep development moving quickly.
7. Jira Dashboard for Executive / Leadership Team
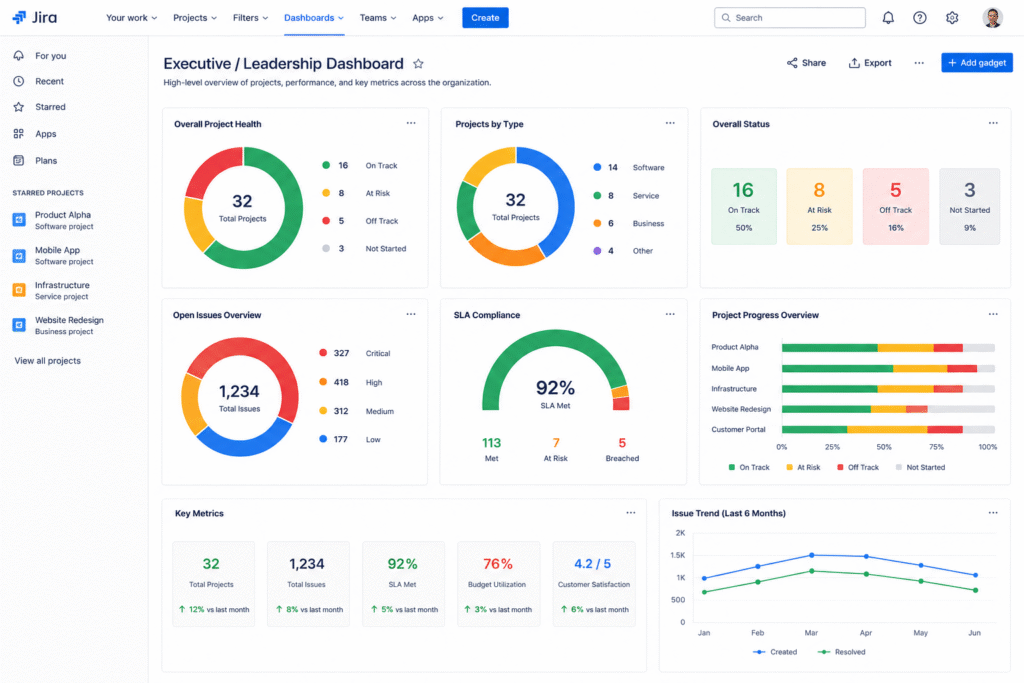
Executives and leadership teams need a high-level overview rather than detailed project information. This dashboard highlights the metrics that matter most, including project health, delivery status, team performance, and overall progress.
Summary gadgets, Pie Charts and key performance indicators provide a quick snapshot without burdening users with technical details.
Leaders can now easily track trends, monitor business goals, identify risks, and make informed decisions with a clear project overview.
8. Jira Dashboard for IT Service Desk / Support Managers
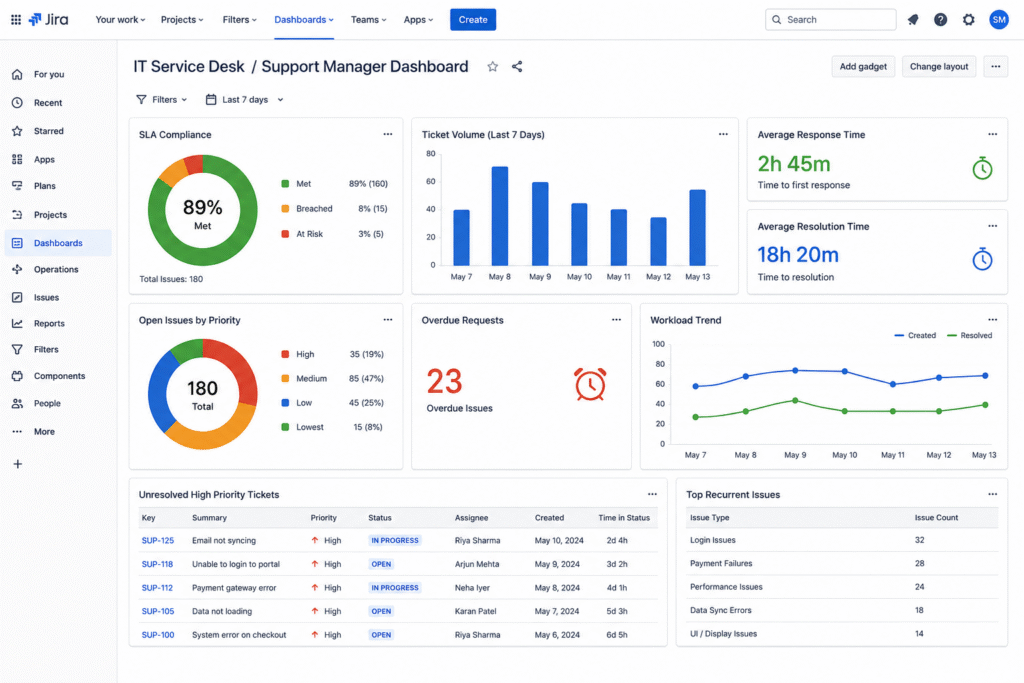
Support managers require a comprehensive view of service performance to ensure that customer issues are resolved on time. This dashboard shows SLA compliance, ticket volume, response times, resolution times, and overdue requests all in one place. Filter Results gadgets can help identify unresolved or high-priority tickets before they have an impact on customer satisfaction.
Trend charts also help to track workload and identify recurring support issues. Support teams can respond faster and provide a better customer experience now that all important service metrics are available in one dashboard.
9. Jira Dashboard for Marketing Managers
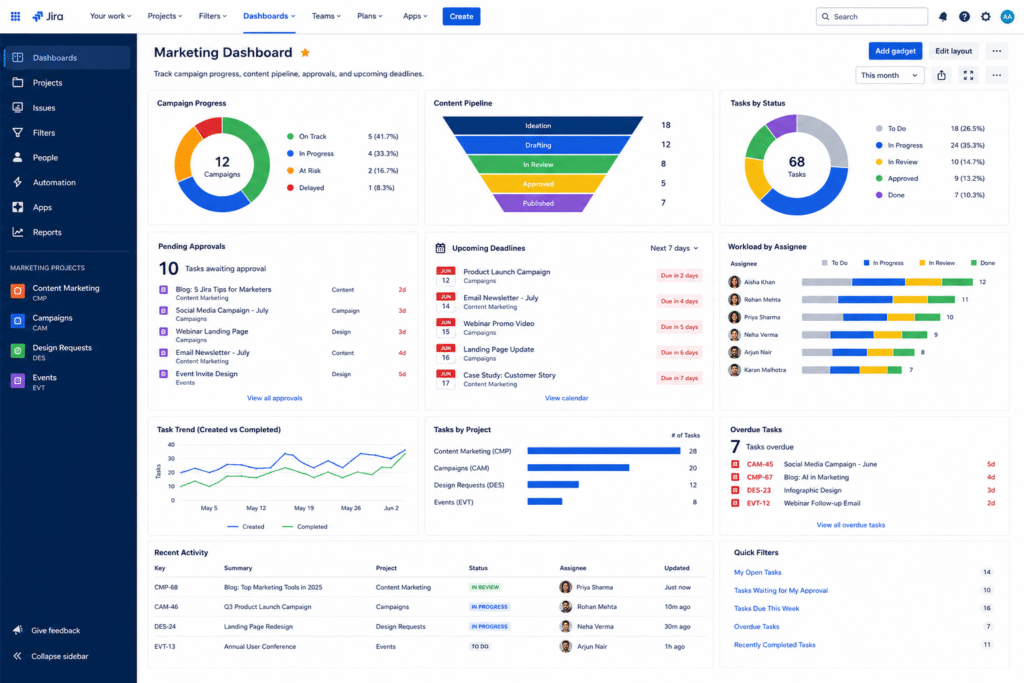
Marketing teams use Jira to manage campaigns, content production, design requests, events, and approval workflows.
This dashboard offers a clear view of campaign progress, content pipeline stages, pending approvals, and upcoming deadlines. Gadgets that monitor task status and workload assist teams in understanding what is on schedule and where potential delays may occur.
Bringing marketing activities together in a single dashboard enhances collaboration among writers, designers, and marketers. It also helps teams stay on track, meet campaign deadlines, and ensure projects are moving along without constant follow-ups.
Conclusion
A Jira dashboard is most valuable when it helps people make better and faster decisions. You don’t need to go through different boards, filters, and reports, you get one place to see what’s most important.
Whether you’re managing sprints, releases, support requests, or business projects, the right dashboard boosts visibility, collaboration, and productivity across your company.
Start with one clear goal, build a dashboard around it, and refine it as your needs evolve.
Start building your dashboard today and turn your Jira data into creative and meaningful action.
FAQs
What are the most useful gadgets in a Jira Dashboard?
Filter Results, Sprint/Burndown charts, Pie Charts, and Two-Dimensional Filter Statistics are the most useful. They cover progress tracking, workload distribution, and issue breakdowns with little extra effort.
Can I share a Jira Dashboard with my team?
Yes, absolutely. It may also be shared with specific groups, individual projects, or your entire company. You manage all of this via the sharing and permissions settings.
How do I create a Jira Dashboard?
Navigate to Dashboards, click “Create Dashboard,” give it a name, and choose a layout. Then, add gadgets linked to saved filters, save your work, and adjust permissions as necessary.
What is the difference between a Jira Dashboard and a Jira Board?
A Jira Board, like Scrum or Kanban, manages daily workflow and issue movement. A Jira Dashboard visualises data and metrics pulled from one or several boards or projects.